
Table of contents
Generate summary with AI

Threshold-based alerting works fine on one machine. Stretch the same assumptions across a distributed, multi-region Linux fleet, and a transient network blip two hops away starts looking identical to a genuine outage. Monitoring a handful of servers and monitoring hundreds of distributed nodes are competely different disciplines.
Fleet monitoring is exactly where that risk shows up first, in the form of noisy, unreliable alerts that erode trust in the whole system. So here is what we think is a better way to monitor a distributed fleet of Linux servers at scale.
Note: This post isn’t about the specific things you can do to monitor the Linux performance on a specific endpoint. For that, check out our guide to monitoring Linux performance. This post walks through where fleet-scale monitoring actually breaks down, what to track and where the thresholds should sit, how the major tools stack up against each other, and the deployment mistakes that turn a good monitoring setup into a source of noise instead of signal.
Key challenges of monitoring Linux fleets at scale
Monitoring one Linux box is a solved problem because top, free, iostat, and a handful of thresholds will get you most of the way there. Monitoring hundreds of them spread across regions, cloud providers, and data centers introduces failure modes that don’t show up until you’re operating at that scale.
Here are the main things that make it difficult to track at scale:
Telemetry latency and network flaps
Monitoring a server over a WAN link means the network itself becomes part of what you’re measuring. A brief spike in latency or a dropped packet between regions can look identical to the server actually going down, and legacy monitoring setups that treat any missed check-in as an outage will page someone for a problem that isn’t there.
Uptime Institute’s 2026 Annual Outage Analysis found that outages tied to fiber and connectivity issues are becoming more common and are increasingly likely to turn into longer disruptions.
At fleet scale, distinguishing “the network lagged for a bit” from “the entire server is down” has to be built into the alerting logic itself, not left to a technician’s judgment call at 3 AM when they aren’t even at the server’s location.
Ephemeral infrastructure and node churn
Auto-scaling groups, container orchestration, and bare-metal provisioning mean a meaningful share of the nodes in a modern Linux fleet won’t exist for very long. Sysdig’s 2023 Cloud-Native Security and Usage Report found that 72% of containers live fewer than five minutes. That’s how quick containerized workloads disappear and why continuous visibility is essential.
“Monitoring static workstations is predictable, but monitoring a fleet of short-lived Linux nodes requires real-time adaptiveness to prevent ‘ghost’ alarms.”
Ruben Castellano Gonzalez , Industrial Cybersecurity & Infrastructure Expert
Monitoring built around the assumption that a server sticks around for months will generate a stream of false “host down” alerts every time a node winds down on purpose. At scale, the monitoring layer needs to know the difference between a node that failed and one that was never meant to last.
» Make sure you know what a node is in networking
Data sovereignty and cross-border telemetry
Collecting syslog data, performance metrics, and application telemetry from servers spread across multiple countries runs straight into regional data regulation, such as GDPR in the EU, LGPD in Brazil, and similar frameworks elsewhere.
Shipping logs containing user metadata to a single central repository in another jurisdiction can create compliance exposure that didn’t exist when everything sat in one data center.
Cisco’s 2026 Data and Privacy Benchmark Study found that 81% of organizations are facing increased demand for data localization, and 85% say localization requirements add cost, complexity, and risk to running services across borders. A monitoring architecture built for a single region doesn’t automatically hold up once telemetry has to respect where the data is allowed to live.
Resource overhead from the monitoring agent itself
Every monitoring agent competes with the workload it’s watching for CPU, memory, and I/O. That tradeoff is invisible on one server but compounds across a fleet.
A heavier daemon running on thousands of production hosts adds up to a real, measurable tax on the infrastructure it’s supposed to be protecting. The heavier the agent, the more that observation itself starts distorting the numbers it’s reporting, which is exactly the failure mode a monitoring setup is supposed to catch, not cause.
» Still building your server? Don’t miss these top server racks
7 best tools for monitoring Linux servers at scale
Here’s how the seven tools worth knowing for Linux fleet monitoring stack up, such as where each one fits, what makes it distinct, and where it starts to strain at scale.
Tool | Best for | Best feature for monitoring Linux servers at scale | Biggest weakness |
Atera | IT teams and MSPs managing distributed Linux fleets who want monitoring, alerting, and remediation in one console | Threshold alerts, scripting, and patching all live in a single platform | Highly customized log routing at extreme scale may need a dedicated aggregation layer |
Prometheus | Cloud-native teams and platform engineering groups running Kubernetes-heavy environments | Pull-based collection with PromQL for precise, flexible querying | Single-node by default, so it needs Thanos or Grafana Mimir bolted on to scale |
Zabbix | Traditional data centers and telecoms with mixed on-premises, virtual, and cloud infrastructure | Regional proxies buffer data locally, cutting WAN latency issues | Central database becomes a bottleneck at very high ingestion volumes |
Datadog | Organizations that want Linux metrics correlated directly with application traces | One platform links host-level spikes straight to the application causing them | Modular, usage-based pricing that’s hard to forecast as a fleet grows |
Netdata | Admins and SREs who need immediate visibility into one server with no setup | Auto-detects everything on a node and gives a working dashboard in minutes | Not built as a fleet-wide console without routing through Netdata Cloud |
Nagios Core | Legacy or highly static environments needing simple up/down checks | Plugin architecture can check almost anything with a script | Fork-and-exec model burns CPU on the monitoring server at high check volumes |
Glances | Individuals who want a fast, complete view of one server from the terminal | Zero-config, portable, and scriptable via its JSON API | No historical database or alert routing, so it can’t run fleet-wide monitoring |
Best overall: Atera

Atera is a unified RMM and PSA platform, combining remote monitoring, ticketing, automation, and Autonomous IT into a single console rather than requiring separate tools for each layer.
It’s best for IT teams and MSPs managing distributed Linux fleets across on-premises, cloud, and edge environments who want monitoring, alerting, and remediation in one console instead of stitched-together tooling.
Features and capabilities
Atera’s standout feature for Linux server monitoring at scale is consolidation. Threshold-based alerts, remote scripting, and patch management all live in the same place a technician is already working, so a fleet-wide problem or software deployment doesn’t require jumping between a monitoring dashboard, a separate scripting tool, and a ticketing system to resolve.
Additional features include:
- Automated and scheduled patch deployment across endpoints
- Remote PowerShell/scripting execution targeted at selected devices or device groups on demand
- Auto-healing scripts that trigger automatically when a defined threshold is exceeded
- Asset and inventory scanning across the fleet
- AI Copilot for generating custom scripts from plain-language instructions and guiding technicians through remediation workflows
- Splashtop-based remote access for direct troubleshooting
- Per-technician pricing with unlimited monitored endpoints, which decouples licensing cost from fleet size
Real-time monitoring and alerting works across servers, with SNMP monitoring and remote management from one console. Threshold-based alerts fire automatically when a monitored condition is breached, and depending on site, device, or severity settings, an alert can automatically generate a ticket and route it to the right technician or group, with time-based rules escalating it if it sits open too long. That means a degrading disk or a maxed-out load average doesn’t wait for someone to notice it in a dashboard.
» Learn more about installing Atera’s Linux Agent
Best for platform engineering groups running Kubernetes-heavy environments: Prometheus
Prometheus is an open-source monitoring system built around a pull-based collection model and its own query language, PromQL. It’s best suited to cloud-native teams and platform engineering groups running Kubernetes-heavy environments with workloads that scale dynamically.
Features and capabilities
Prometheus actively polls targets on a configured interval rather than waiting for them to push data, which fits environments where services and nodes are created and destroyed constantly. PromQL’s label-based data model lets engineers query across millions of time-series points with precision.
Additional features include:
- Native Kubernetes service discovery
- The Prometheus Operator pattern, letting monitoring rules and targets be defined as version-controlled YAML alongside application code
- A large open-source exporter ecosystem for Linux, hardware, and third-party services
A standalone Prometheus server is single-node and stores metrics locally. That means at high scale it can run into memory pressure under heavy querying, since it wasn’t built to cluster or scale horizontally on its own. Once a fleet’s metrics volume outgrows what one instance can hold, teams typically add a long-term storage backend like Thanos or Grafana Mimir to remote-write into. Prometheus can also work with Pushgateway for certain short-lived jobs.
These augmentations don’t collect metrics themselves, but rather extend Prometheus’s retention and query capacity once it’s already the collection layer. It’s an add-on for scale, not a separate monitoring choice.
Best for traditional data centers and telecoms: Zabbix

Zabbix is a free, open-source monitoring platform with no licensing restrictions on the number of hosts, metrics, or alerts. It’s greatly suited to traditional data centers, telecoms, and organizations with a mix of on-premises, virtual, and cloud Linux infrastructure that want agent-based and agentless monitoring without per-host licensing.
Features and capabilties
Zabbix proxies act as regional collectors, which means they buffer performance data locally and report back to a central server. This mitigates WAN latency for geographically distributed fleets in a way a single central server can’t.
Additional features include:
- A JSON-RPC API for programmatically registering hosts and updating templates
- Native Ansible modules for automating agent deployment
- A fully open-source model with no artificial ceiling on monitored hosts
At very high ingestion volumes, the central relational database (PostgreSQL or MySQL) becomes the bottleneck. In larger deployments, teams typically address this by tuning the database, partitioning data, or increasing storage performance so the central server can keep up with the incoming volume.
Best for correlating Linux infrastructure metrics with application traces and logs: Datadog
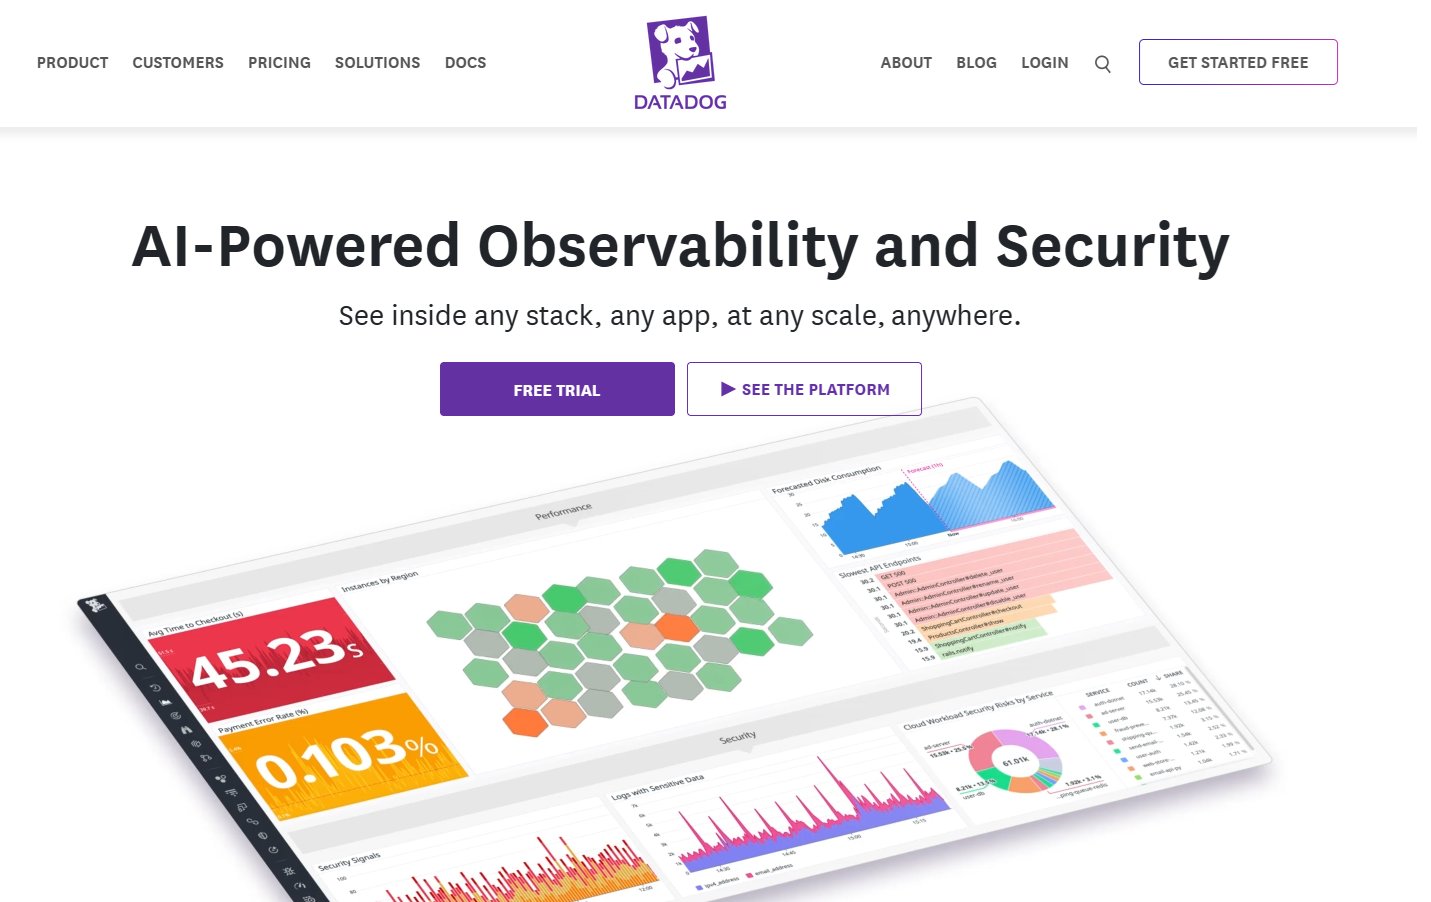
Datadog is a commercial, cloud-based observability platform unifying infrastructure monitoring, APM, and log management. Though it requires a steep budget, the organizations that can afford it find the best use in a single platform correlating Linux infrastructure metrics with application traces and logs.
Features and capabilities
Host-level Linux metrics sit in the same pane as application traces, so a technician doesn’t have to manually cross-reference two separate tools to connect the two.
If a server’s load average spikes, the same platform already has the application traces running on that host at that moment, so the technician can trace the spike directly to the specific service or process driving it, rather than SSHing in to investigate and then pulling up a separate APM tool to confirm the cause.
Additional features include:
- A comprehensive Terraform provider that lets dashboards and monitors be managed as code
- Anomaly detection built into the platform
- One of the broadest third-party integration catalogs in the category
Datadog uses modular, usage-based pricing, so costs can increase as you add hosts, metrics, logs, and other billable usage that scales separately and can make costs difficult to forecast as a fleet grows.
Best for immediate visibility into a specific Linux server without lengthy setup: Netdata
Netdata is an open-source monitoring tool offering per-second metric collection with minimal configuration required out of the box. It’s great for administrators and SREs who just need immediate, granular visibility into a specific Linux server without a lengthy setup process.
Features and capabilities
Netdata auto-detects containers, hardware sensors, and running services on install, giving a technician a working dashboard within minutes on any given node. That makes it greatly suited for fast diagnosis even if it’s not the primary fleet-wide system of record.
Additional features include:
- A lightweight, low-overhead collection engine designed for per-second granularity
- Kickstart-script installation compatible with Ansible and Cloud-Init pipelines
- Helm charts for Kubernetes deployment
Netdata was built as a per-node tool first. Centralizing and aggregating data from thousands of separate node instances generally means routing through Netdata Cloud or running resource-heavier streaming parent nodes. That means it’s not a natural fit as a single fleet-wide console on its own.
Best for legacy or highly static environments: Nagios Core
Nagios Core is a long-standing open-source monitoring tool built around a plugin architecture that returns simple status codes (OK, Warning, Critical, Unknown). This simplicity makes it greatly suited to environments that need reliable up/down status checks rather than deep telemetry, such as government agencies or traditional enterprises.
Features and capabilities
Its plugin model means almost anything can be checked with a script, and NRPE lets those checks run locally on remote Linux hosts and report back. That makes it a flexible (but manual) way to extend simple Linux monitoring to fleet scale.
Additional features include:
- A large library of community-written plugins
- Configuration-as-text-files, which teams often template with Ansible or custom scripts
- A long track record and predictable, well-documented behavior
Nagios executes checks by forking a new process for each one. At high check volumes (the kind a large fleet generates), that fork-and-exec model consumes significant CPU on the monitoring server itself, which is a real scalability ceiling compared to event-driven tools.
Bonus tool for simplicity: Glances (CLI utility)
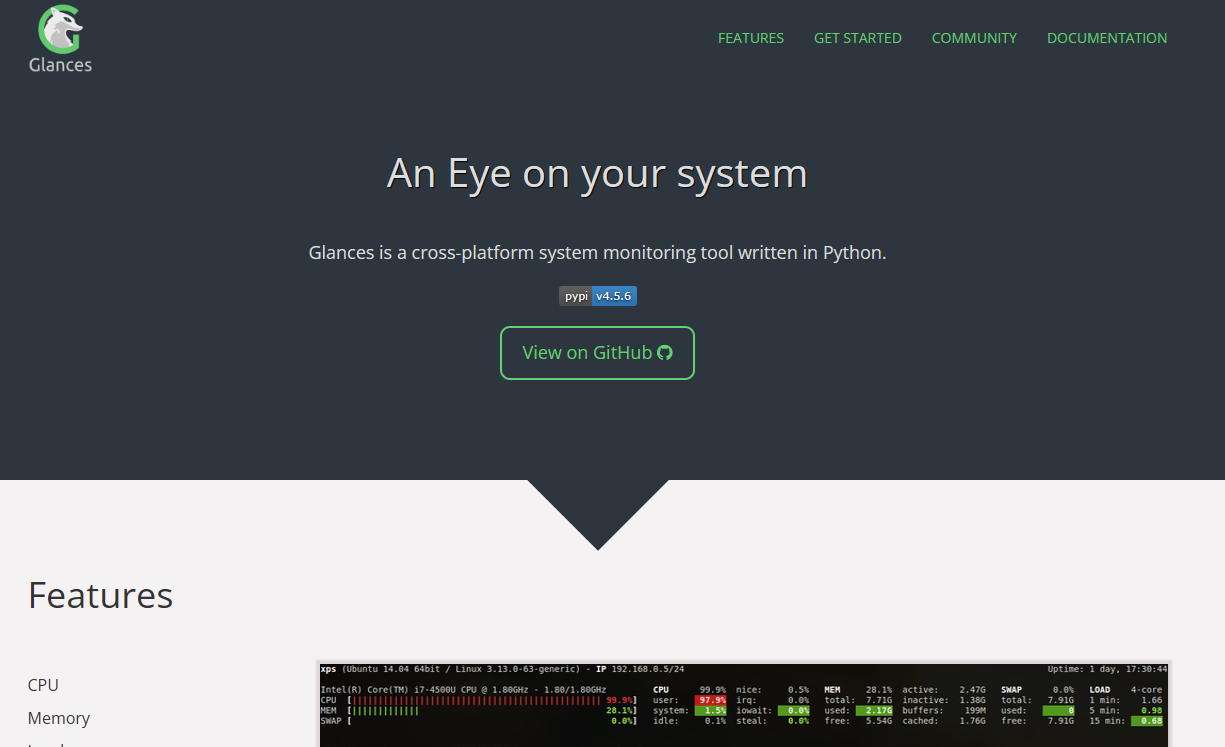
Glances is a lightweight, open-source CLI monitoring tool that packs CPU, memory, disk, network, and process data into a single terminal view. It might not be designed for fleet scale, but it’s still suitable for individual developers, sysadmins, and engineers who want a fast, complete view of one server’s state from the terminal.
Features and capabilities
It’s not really a fleet tool; its value at scale is as a fast diagnostic companion. It can spin up a local web server for a browser view, and it exposes live system state over a JSON API, so it’s easy to script against or drop into a container image for quick health checks during testing.
Additional features include:
- Runs as a Docker container or Python package, making it portable across environments
- A JSON/XML-RPC API for querying live state programmatically
Glances has no built-in historical database, long-term aggregation, or alert routing. It’s built to inspect one node in real time, not to serve as the monitoring system for a fleet of hundreds or thousands.
» See our picks for the top sysadmin tools to boost IT productivity
What a monitoring platform needs to hold up at fleet scale
Once you’re past a handful of servers, the platform itself becomes part of the problem if it wasn’t built for scale. Here are the things we think a great Linux server monitoring tool needs to handle fleets at scale:
- Automated provisioning: The agent needs to install and register itself as part of your existing deployment pipeline (Ansible, Cloud-Init, Terraform), not as a manual step someone repeats hundreds of times.
- Access control: Role-based permissions and SSO guarantee monitoring access follows the same least-privilege rules as everything else in the environment.
- Encrypted telemetry in transit: Performance data traveling over WAN links between regions needs to be encrypted end to end, not just protected at rest.
- Config as code: The ability to define alert thresholds and monitoring rules in version-controlled files rather than clicking through a GUI for every host group.
- Event-driven alert routing: Webhooks or API-based handoffs into whatever ticketing or incident tool your team already uses, so a threshold breach doesn’t dead-end in a dashboard nobody’s watching.
- Adaptive data collection: The ability to throttle, batch, and compress outbound telemetry so a fleet-wide rollout doesn’t quietly become a bandwidth and egress cost problem.
» Learn more in our guide to choosing the best RMM solution
The metrics you should be tracking
Once you’ve chosen the tool you want to use to monitor your fleet of Linux machines, you’ll need to know what metrics you should actually be tracking. Essentially, comprehensive Linux server health monitoring comes down to three layers:
- Kernel and compute: CPU utilization (broken out by user vs. system), load average (measured over 1, 5, and 15-minute windows), and context switches.
- Memory: Available memory (not just used RAM), swap usage, and OOM killer activity.
- Storage and network: Disk I/O wait and network packet drops or errors.
The table below reflects the thresholds most sysadmins use as a starting baseline. Treat these as reasonable defaults to tune from, not hard rules, since normal ranges vary by workload:
Metric | Healthy range | Watch for |
|---|---|---|
CPU utilization | Under 70% average | Sustained above 85% for a few minutes |
Load average | At or below total CPU core count | Above 1.0x core count, which signals process queuing |
Available RAM | Above 15% of total physical memory | Below 10% available (risk of swapping) |
Disk I/O wait | Under 5% of CPU time | Sustained above 20 – 30% (storage bottleneck) |
Swap usage | Under 5% of configured swap | Above 10% (memory pressure) |
Disk latency | SSD: about 0.1- 1 ms, NVMe: under 0.1 ms, HDD: about 5 – 20 ms | Above those baselines for your device type |
Network packet drops/errors | Near zero under normal conditions | Any sustained rise or repeated drops/errors |
» Here’s how to check the list of open ports on Linux
Avoiding deployment mistakes and monitoring blind spots
Most fleet-monitoring failures aren’t caused by a bad tool choice. They come from a handful of configuration habits that work fine on a few servers and quietly break down at a certain point.
The most common ones include:
Static, uniform alert thresholds
Applying the same CPU or memory threshold across every production, database, and dev server ignores the fact that normal baselines differ by workload.
“It’s not obvious, but not all usage is the same. A database server running hot at 75% CPU during a nightly batch job isn’t the same event as a web server hitting 75% at 3 AM.”
Ruben Castellano Gonzalez , Industrial Cybersecurity & Infrastructure Expert
The fix: Audit alert volume per host over the last 30 days and replace flat thresholds with baselines set per server role.
Missing local buffering on telemetry pipelines
Streaming verbose logs and high-frequency metrics straight to a central repository over WAN links, with no local buffer or throttling, saturates network bandwidth the moment something goes wrong. Unfortunately, that’s exactly when you need that bandwidth most.
The fix: Cap local memory buffers (for example, 500MB) and enable disk-assisted queues in whatever’s shipping your logs, whether that’s fluentd, rsyslog, or an agent’s built-in buffering.
Running monitoring agents with unrestricted privileges
Deploying an agent as root or embedding plaintext credentials in a config file just to collect performance metrics turns a monitoring tool into an attack surface. Credential-based access remains a major factor in breaches.
For example, Verizon’s 2026 Data Breach Investigations Report found that exploitation of vulnerabilities became the leading initial access vector, accounting for 31% of breaches, while credential abuse fell to 13%.
The fix: Run monitoring daemons under a dedicated, unprivileged user, and store credentials in environment variables or a secrets manager like HashiCorp Vault, not in a config file on disk.
Not monitoring the monitor
There’s a failure mode none of the above catches, which is when the monitoring pipeline itself goes down and nobody notices because the thing that would have alerted them is what broke.
The fix: Preventing this requires a “who monitors the monitor” setup, built on three pieces:
- An independent monitoring zone: A separate, secondary instance (different region, or on-premises) whose only job is checking the health of the primary monitoring cluster.
- Heartbeat checks: The primary system periodically pings an external service; a missed ping means the pipeline is down, and that triggers its own alert.
- Synthetic transaction probes: Lightweight, external checks that simulate an end-to-end metric flow, confirming data isn’t just being sent but actually indexed and usable.
None of these pieces are complicated individually. What matters is that they’re decoupled from the system they’re watching. If your meta-monitoring shares infrastructure with your primary pipeline, a big enough failure takes both down together, which defeats the purpose.
» Don’t miss our guide to AI-powered network monitoring
Monitoring at scale takes more than more dashboards
Even with the right tool and strategy, you can’t discount the discipline and operating model required to run Linux monitoring well at scale. The architectural challenges, the metrics that matter, and the mistakes that create blind spots don’t disappear because a platform is smarter. What changes is how much of that work gets baked into the platform instead of maintained by hand across every host.
Atera’s RMM applies threshold-based alerting and remote scripting across your fleet from a single console, so a widening iowait number or a climbing load average doesn’t sit in a dashboard waiting for someone to notice it. Pair that threshold with an auto-healing script, and the same alert that used to page someone at 2 AM can trigger the fix directly before anyone else even sees it.
Related Articles

How to decide if you need a dedicated DEX platform, or already have one
"IT feels slow" is the complaint that often sells DEX platforms. Sometimes it signals a real blind spot, but just as often already catches and fixes the problem, and a new scoring layer would only add another console. Telling the two apart takes evidence, and the real gap usually isn't visibility at all.
Read now
How to set up secure printing across your organization
A secure print checkbox protects exactly one moment in a document's life. Everything else, from unencrypted traffic and unhardened devices to payroll printouts forgotten in a tray, stays exposed. Real secure printing covers the whole lifecycle: release policy, authentication, encryption, hardening, and a fleet that stays monitored long after rollout.
Read now
How to reduce alert fatigue in healthcare IT
In a hospital, a dismissed alert isn't a delayed ticket. It can be a patient deteriorating while the monitor keeps sounding. Cutting alert volume won't fix that on its own, and switching alerts off can make it worse.
Read now
How to prevent configuration drift across your IT infrastructure
Configuration drift rarely breaks anything the day it happens. It hides in a hotfix, a reset default, or a vendor installer, then surfaces weeks later as a failure nobody can trace. Stopping it means defining exactly what approved looks like, closing every side door into production, giving each setting one owning tool, and checking that the baseline itself hasn't gone stale.
Read nowEndless IT possibilities
Boost your productivity with Atera’s intuitive, centralized all-in-one platform