
Generate summary with AI

By the time a user calls to say a Linux box feels sluggish, the problem has usually been building for hours. Load creeping up, swap slowly filling in, storage queues backing up quietly in the background, and none of it loud enough to trigger an alert. But eventually it’ll take something down.
The good news is that Linux already ships with everything you need to catch this earlier, no extra software needed and no dashboards to configure. Here’s everything you need to know.
What unhealthy Linux performance actually looks like
Most performance investigations start too late. By the time someone reports that a system feels slow, applications may already be timing out, sessions may be freezing, and the underlying cause could have been building for hours or days. Catching that earlier means knowing what to watch before things degrade, not just how to react once they do.
Linux performance comes down to how efficiently the four main resources are being used:
- CPU: Track utilization and load average regularly.
- Memory: Track available memory and swap activity.
- Storage: Track filesystem capacity and storage latency.
- Networking: Track network throughput and errors.
None of these should be read in isolation. A server can show low CPU utilization and still perform poorly if processes are stuck waiting on slow storage, and high memory usage on its own doesn’t mean a system is under pressure since Linux deliberately uses spare RAM for filesystem caching.
That discipline matters because resource exhaustion rarely shows up as one clean symptom. It’s more often a cluster of these symptoms:
- Delayed logins
- Frozen terminal sessions
- Services starting to time out
- High load averages
- Shrinking available memory
- Rising swap activity
- Elevated I/O wait
- Filesystem quietly filling up
Diagnosing CPU, memory, storage, and network with native Linux tools
Six tools cover almost everything you’ll need to isolate a Linux performance problem: df/du for disk space, free for memory, top/htop for runaway processes, vmstat for CPU scheduling versus swapping, iostat for storage bottlenecks, and ss/netstat for connectivity issues. Work through them in the order the symptom points you, not top to bottom.
df and du for resolving a full filesystem
Use this when an application reports “No space left on device” and you need to find the exact filesystem responsible before touching anything.
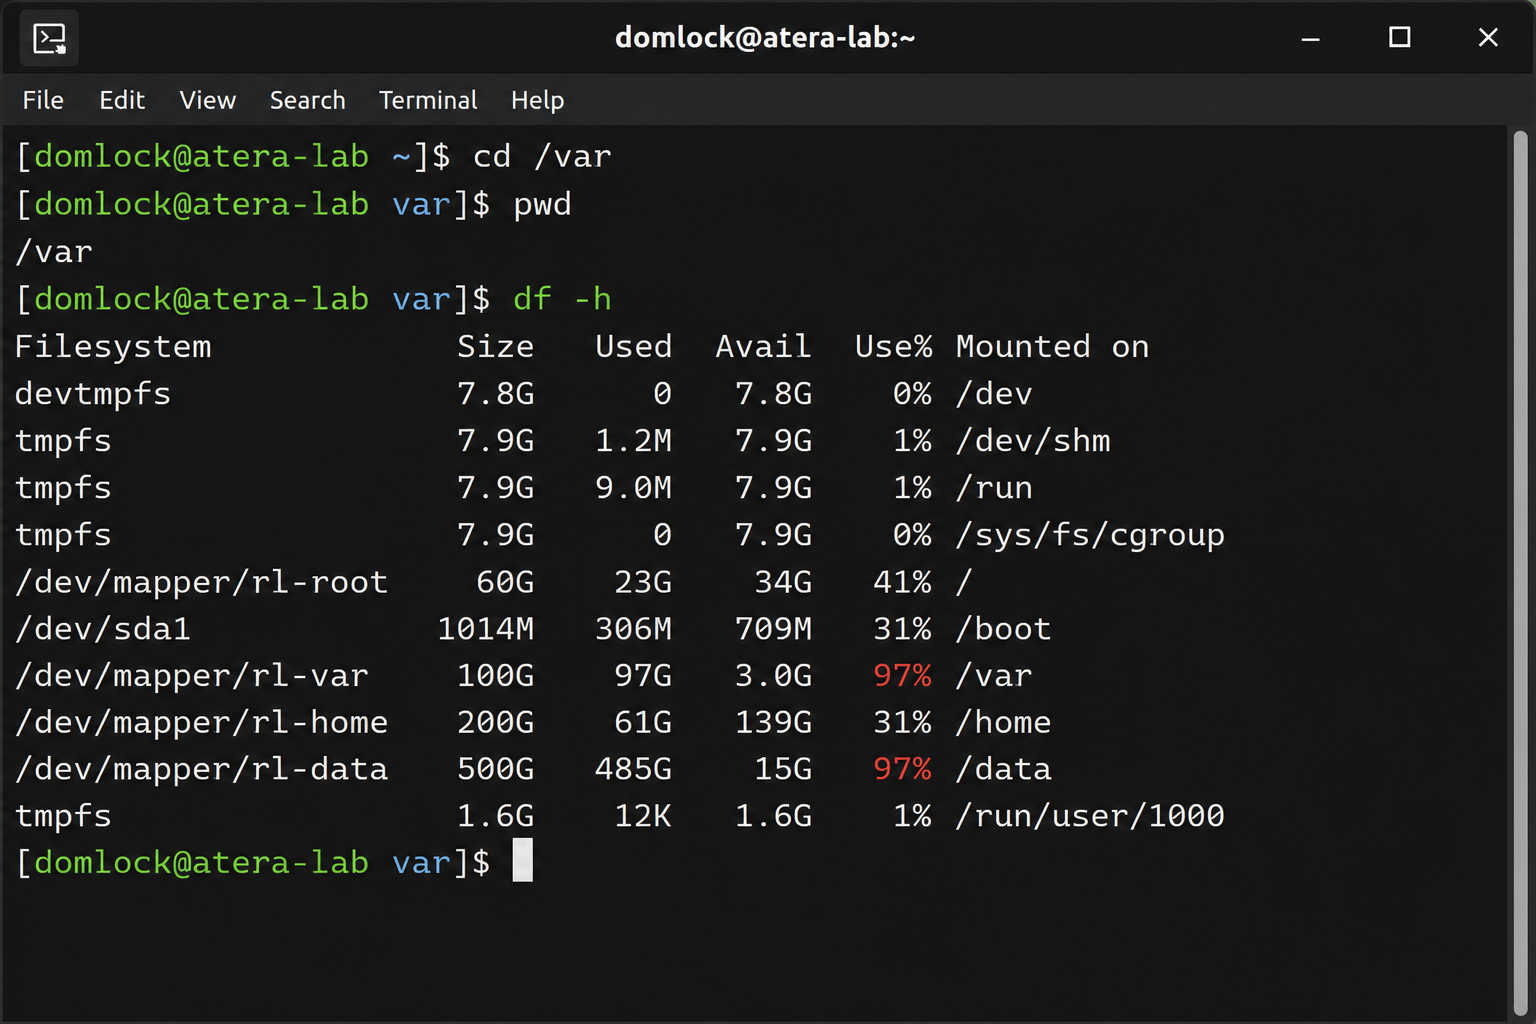
- Run
df -hto see filesystem space usage in human-readable form - Change into the affected mount point with
cd, then confirm your location withpwdbefore doing anything further - Applications often store data on a separate volume from where you’d assume, so check the following columns:
- Filesystem: The storage device or logical volume
- Size: Total filesystem capacity
- Used: Space currently consumed
- Avail: Remaining available space
- Use%: Percentage of space used
- Mounted on: The filesystem mount point
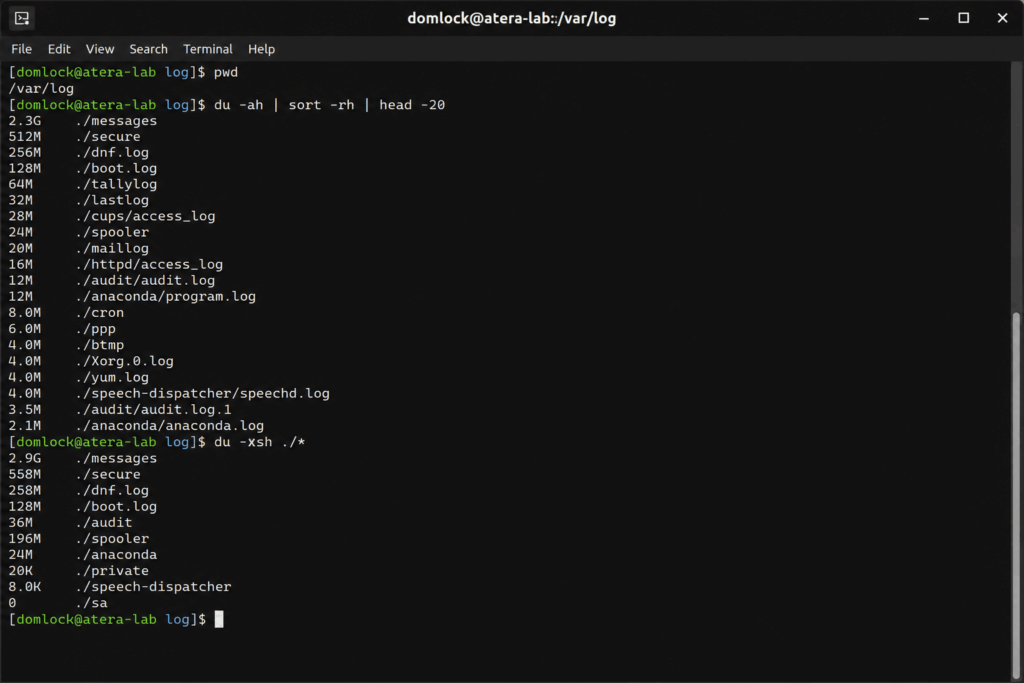
4. Run du -ah | sort -rh | head -20 to list the twenty largest files and directories under your current location
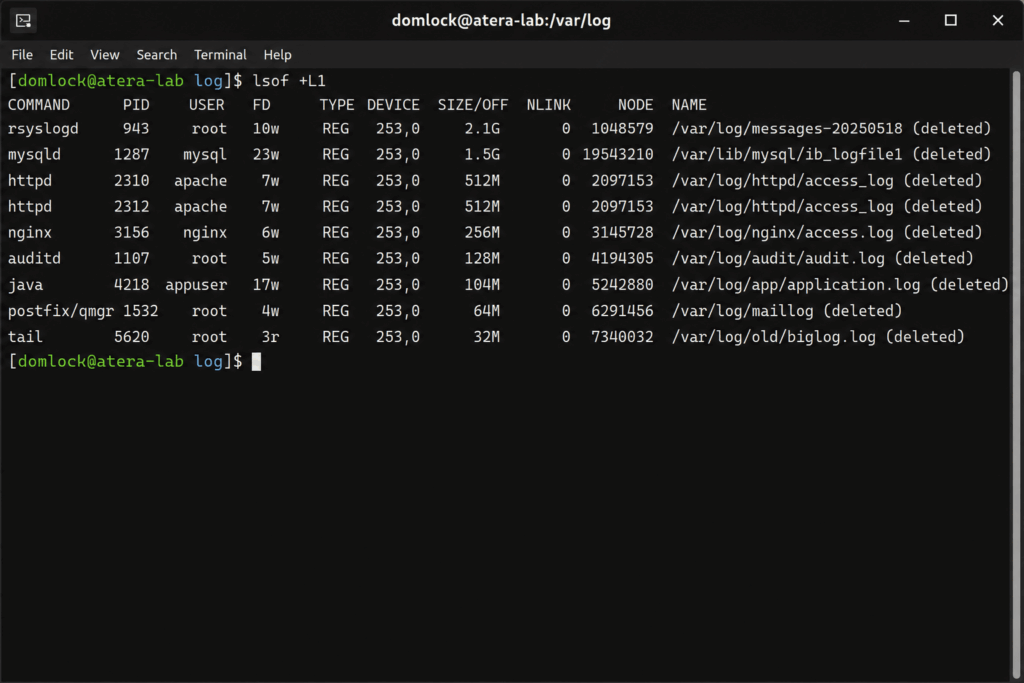
5. Run lsof +L1 and look for files with a link count of zero since this catches space held by a deleted file that a running process still has open, which du can’t account for
6. Once you’ve identified and safely cleared the cause (archived logs, removed failed backups, corrected broken rotation), run df -h again to confirm the space was actually recovered
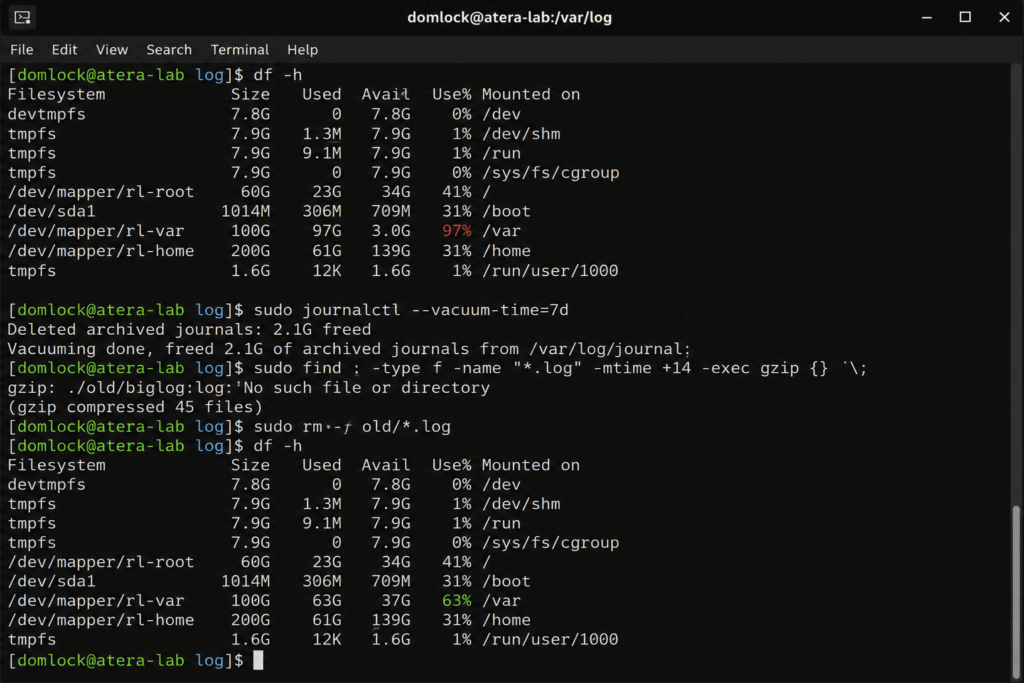
Typical culprits are unrotated log files, failed backups, temporary files, database exports, and core dumps. Recovering the space is only half the job because if you don’t identify why the filesystem filled, the same incident tends to repeat. Check log rotation, backup schedules, and recent configuration changes before closing it out.
» Can’t access the files? Here’s how to change file permissions on Linux
free for verifying memory
Use this when someone assumes a system is low on memory because the Free column looks close to zero, which is usually a misread, not a real problem.
Run
free -hfor a human-readable memory snapshot
Read the Available column, not Free, since it estimates what can actually be allocated to new applications without forcing a swap because Linux deliberately uses spare RAM for filesystem caching
Check the Swap line beneath it. Occasional swap use is normal; steadily climbing swap usage alongside falling Available memory is the real warning sign
If you suspect intermittent pressure rather than a one-off spike, watch it over time with
watch -n 2 free -horvmstat 2instead of relying on a single snapshot
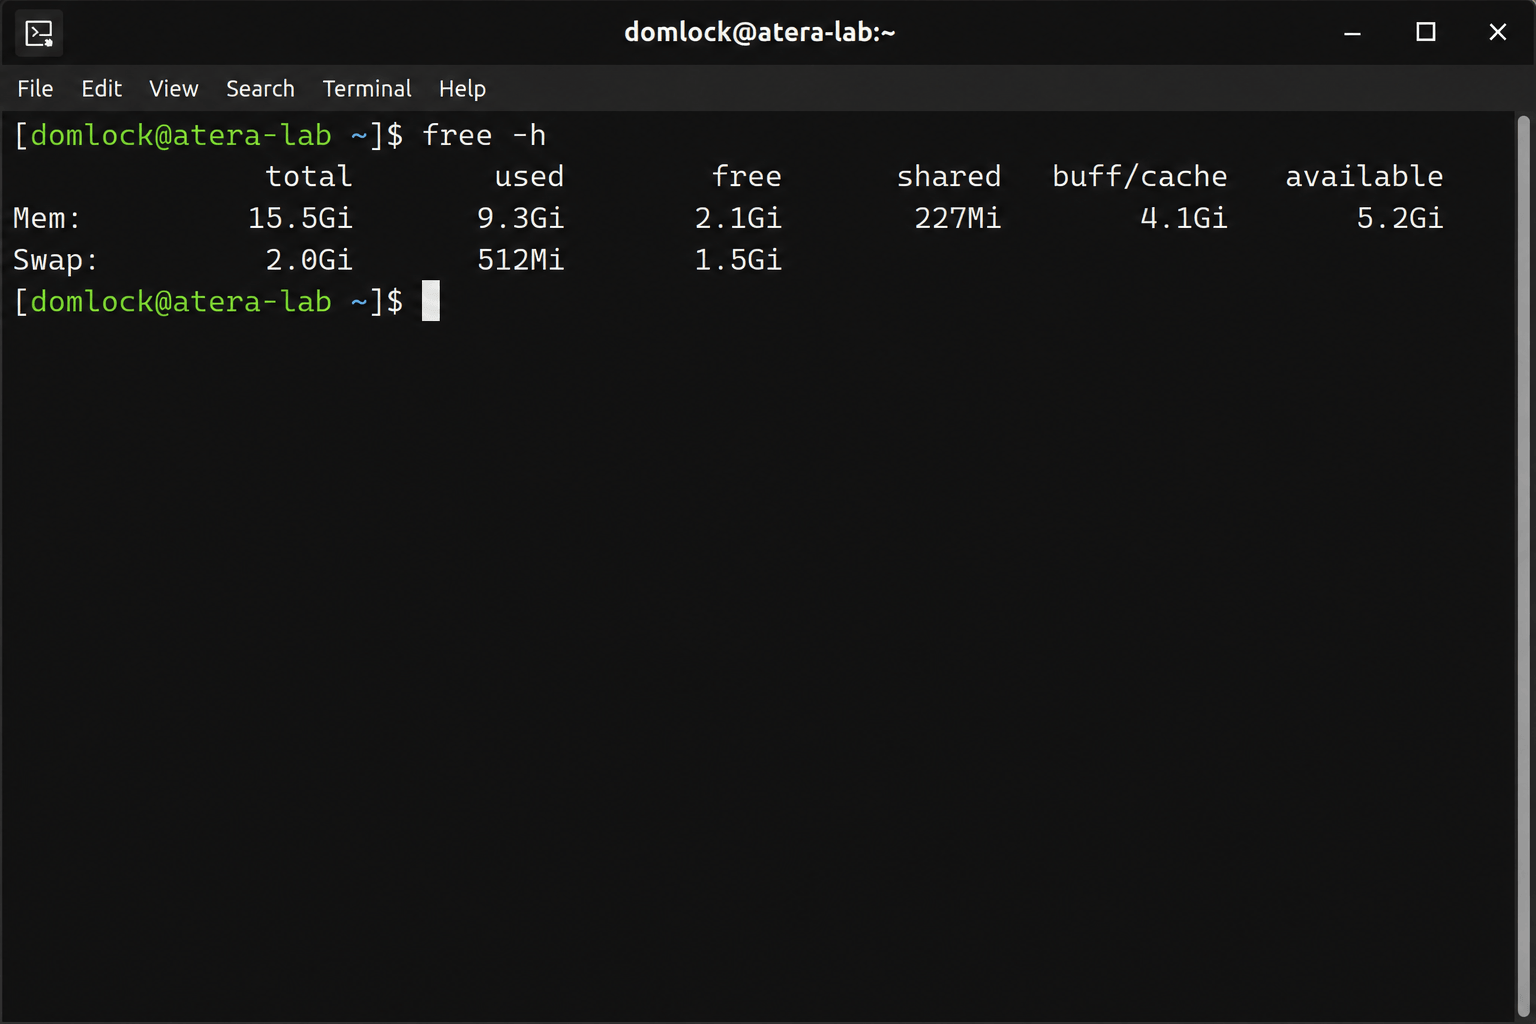
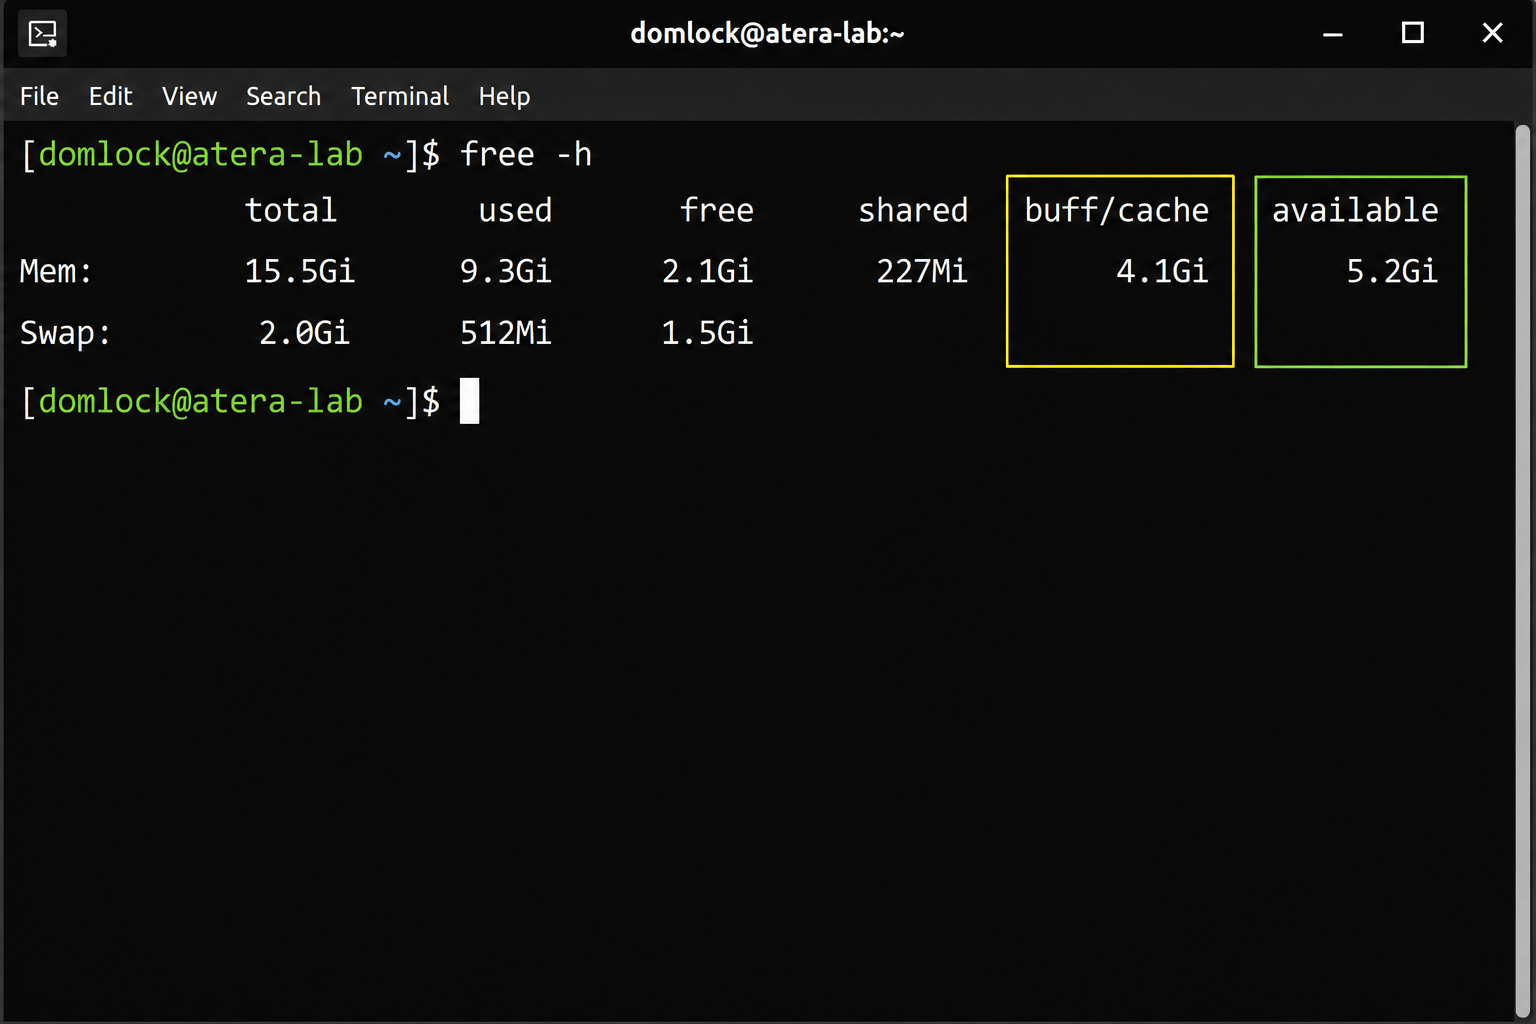
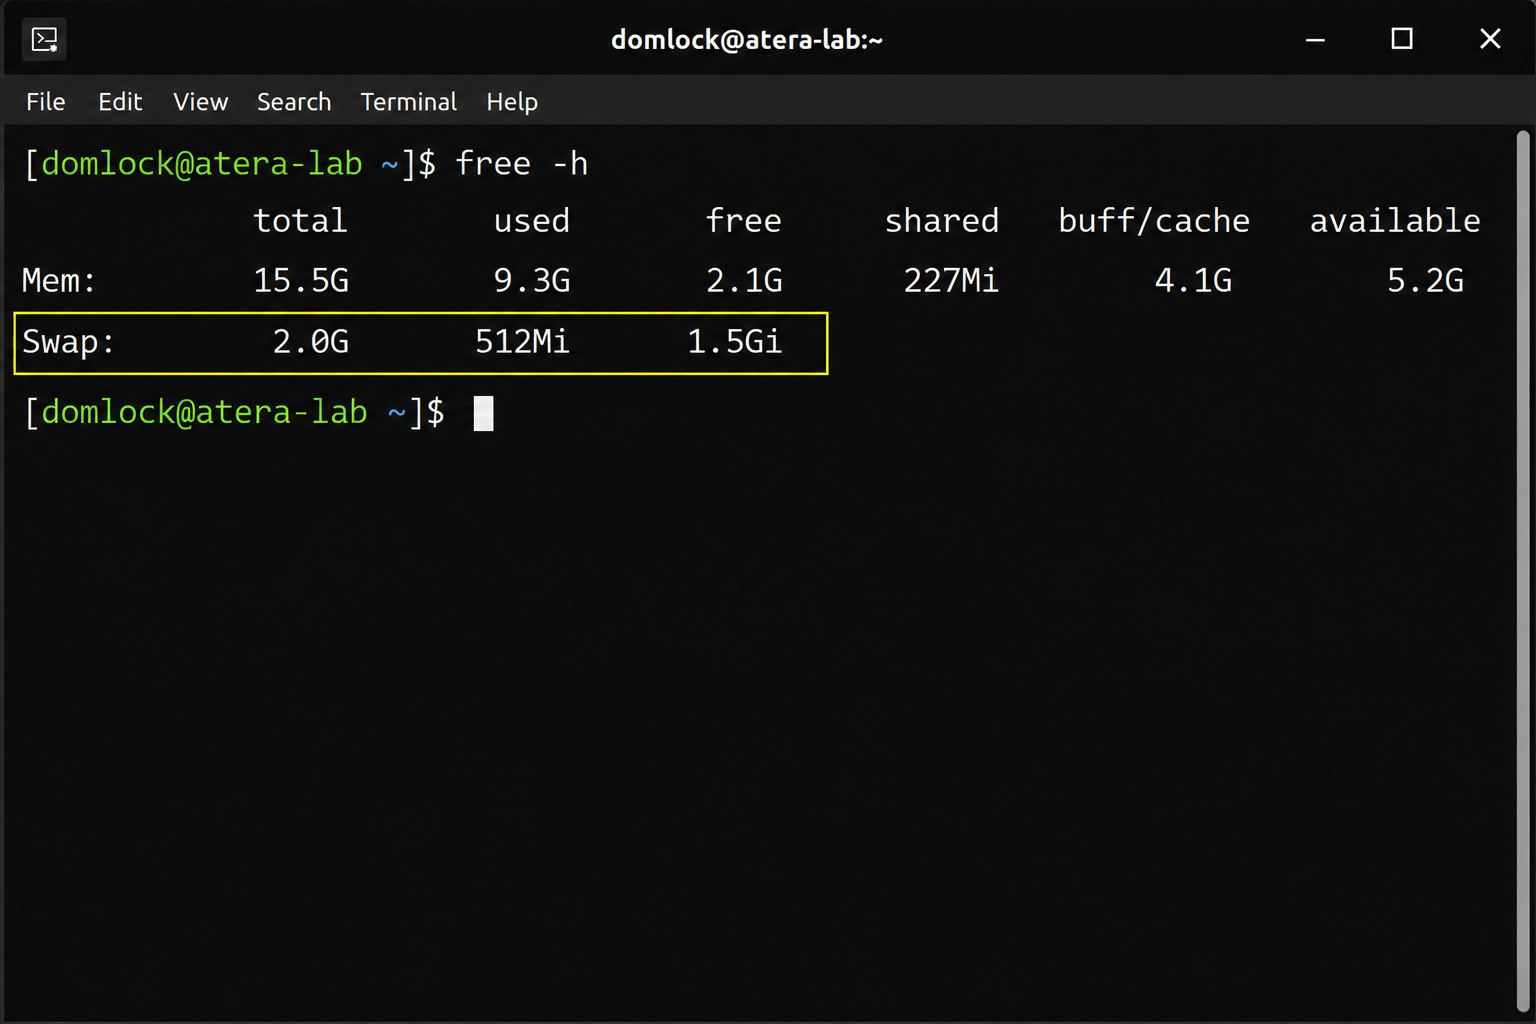
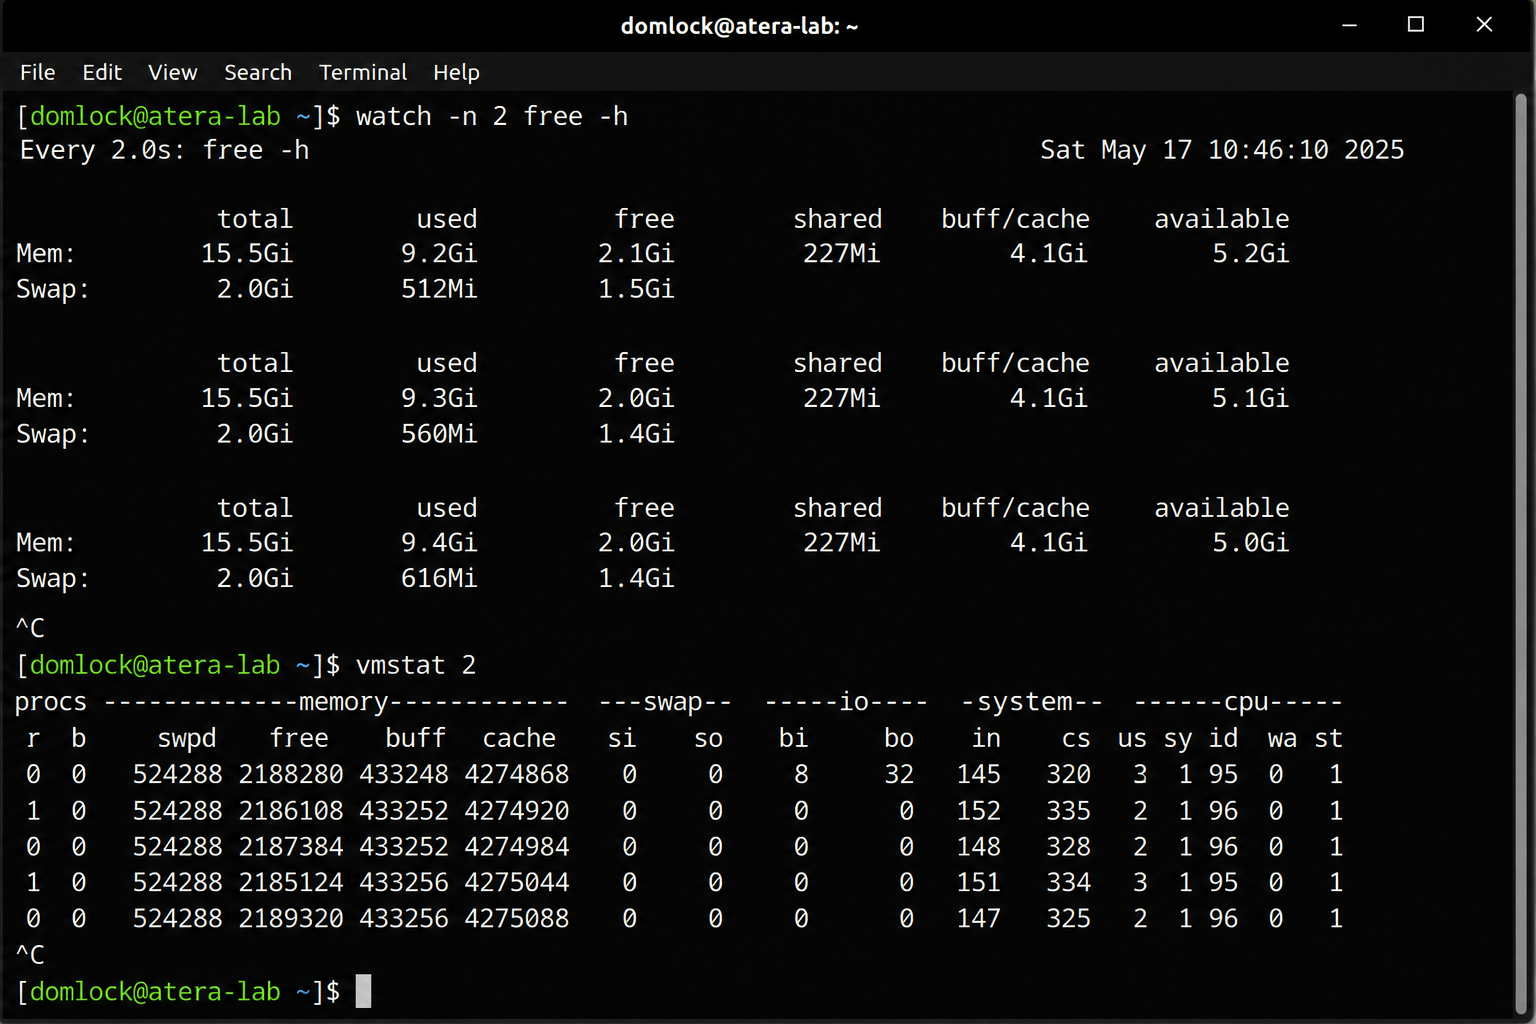
A low Free value on its own isn’t a fire to put out. A falling Available value combined with rising swap is.
» Did you know you can paste into a Linux terminal?
top or htop for finding and handling a runaway process
Use this once memory and disk look fine but something is clearly consuming CPU. Before you touch a process, confirm it’s actually a problem and not legitimate work like a backup or maintenance job.
Run
topand check %CPU, %MEM, load average, and running task countIdentify the busiest process, and ask whether it’s expected, recently started, part of scheduled maintenance, or actually affecting other services
If the workload is legitimate but impacting others, lower its scheduling priority first with
renice +10 <PID>rather than killing it outrightIf it’s unresponsive or actively disruptive, send a graceful shutdown signal with
kill -15 <PID>and wait a few secondsOnly if it ignores that, force termination with
kill -9 <PID>; this skips application cleanup, so treat it as a last resortIf
htopis installed, use it for the same workflow with sortable columns and in-interface signal sending
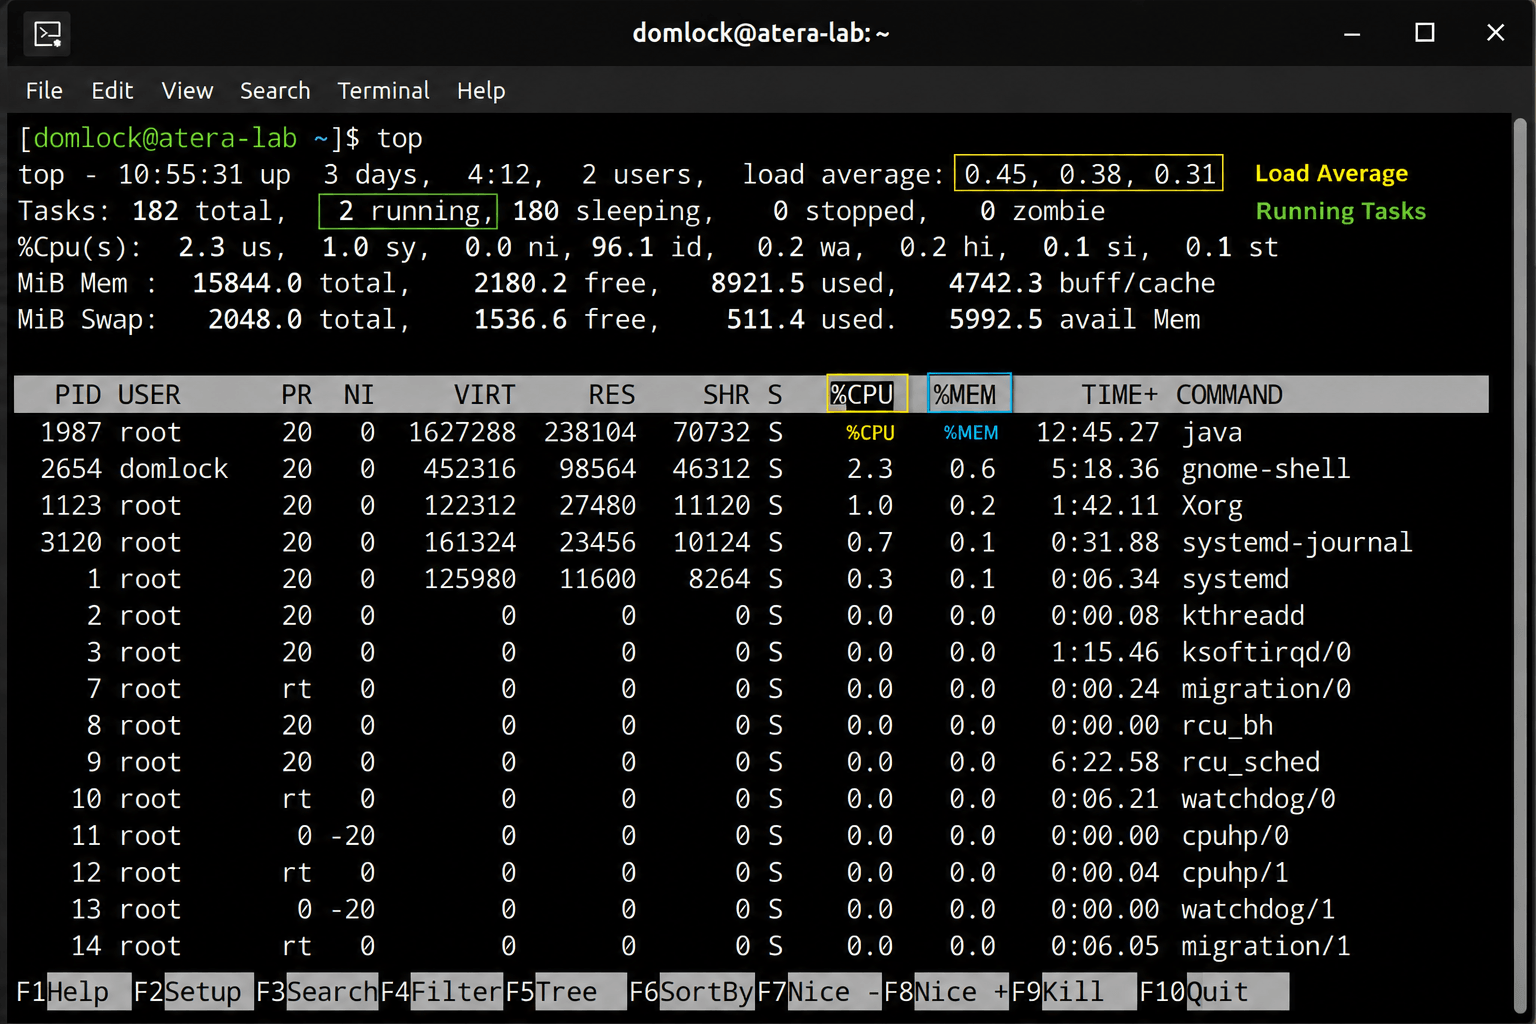
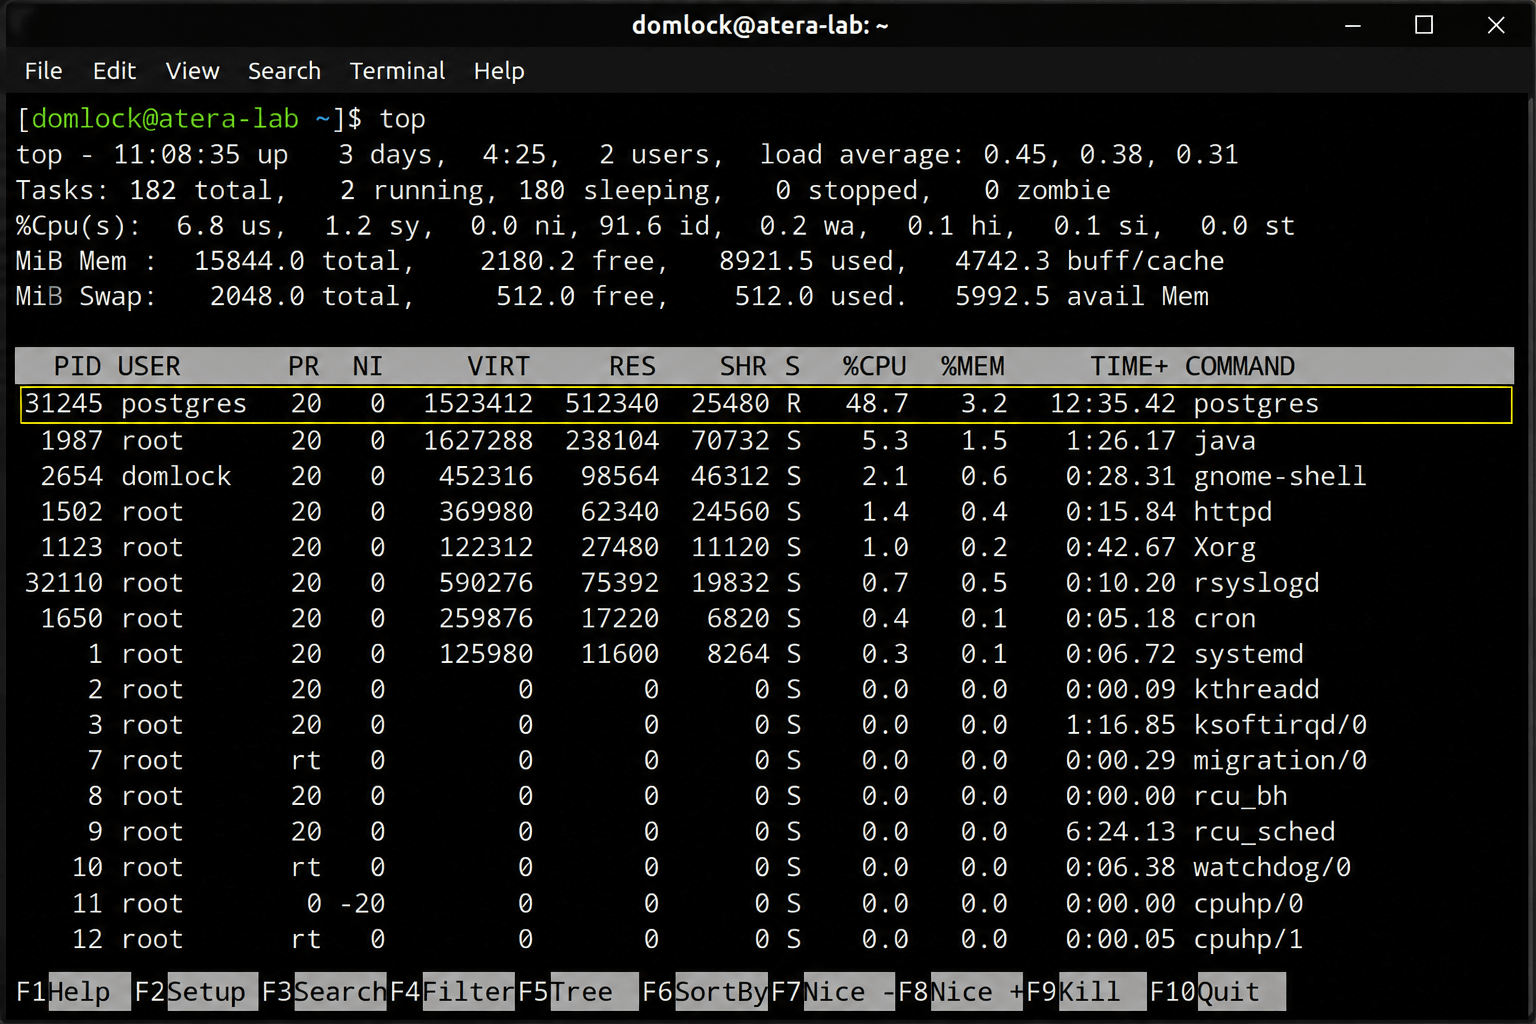
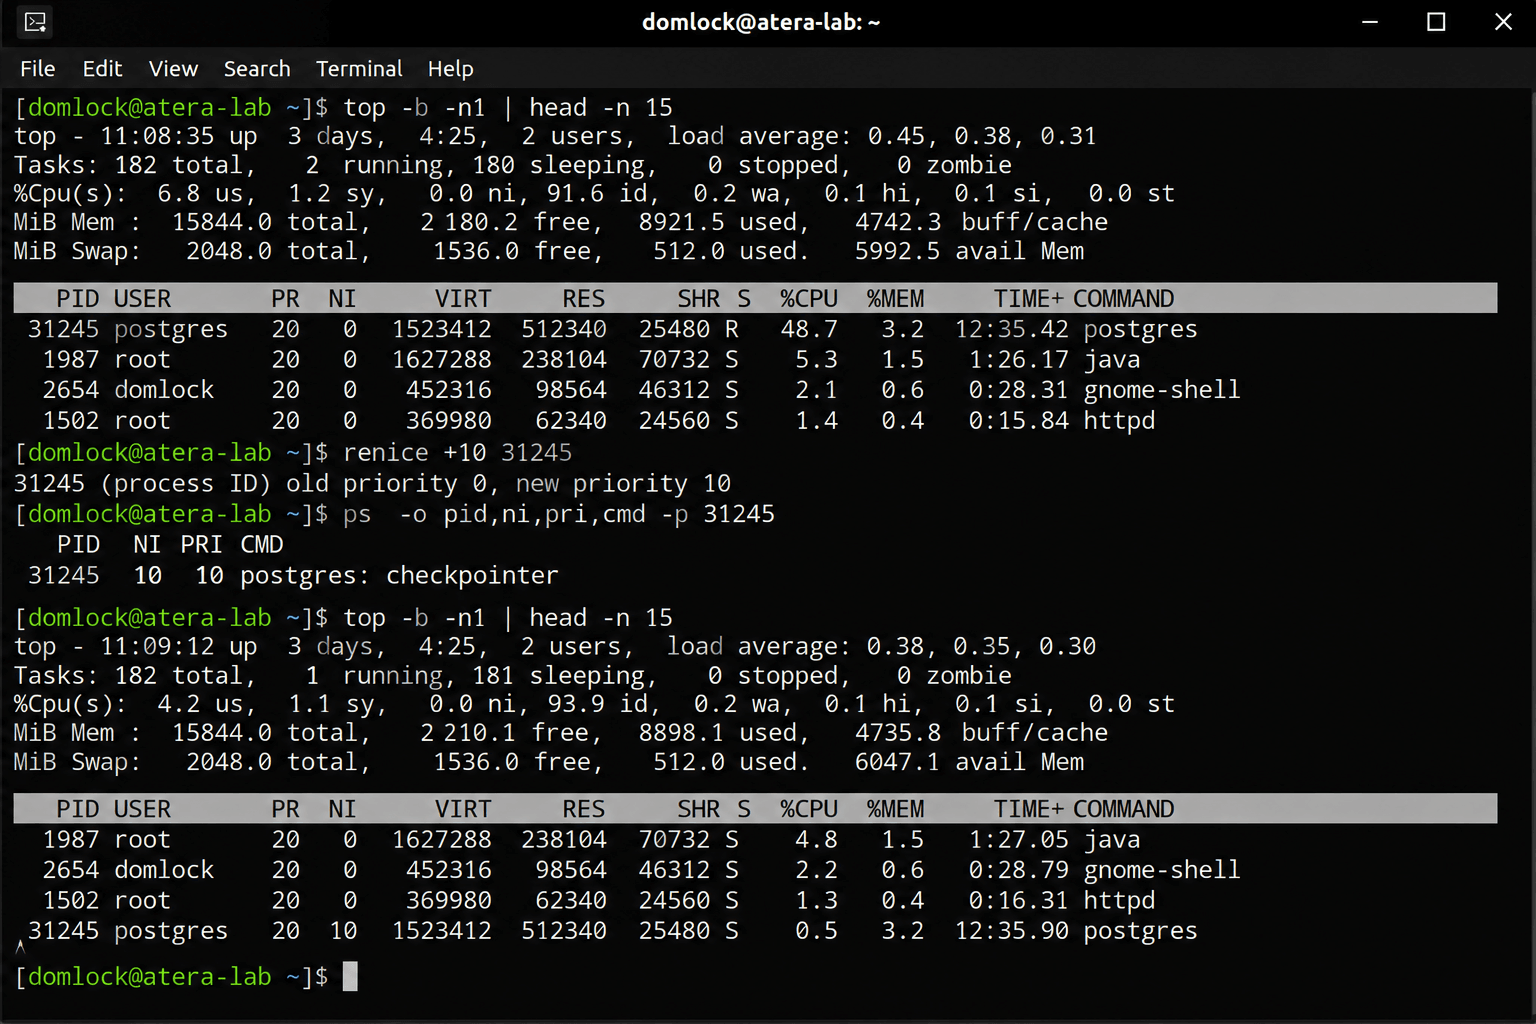
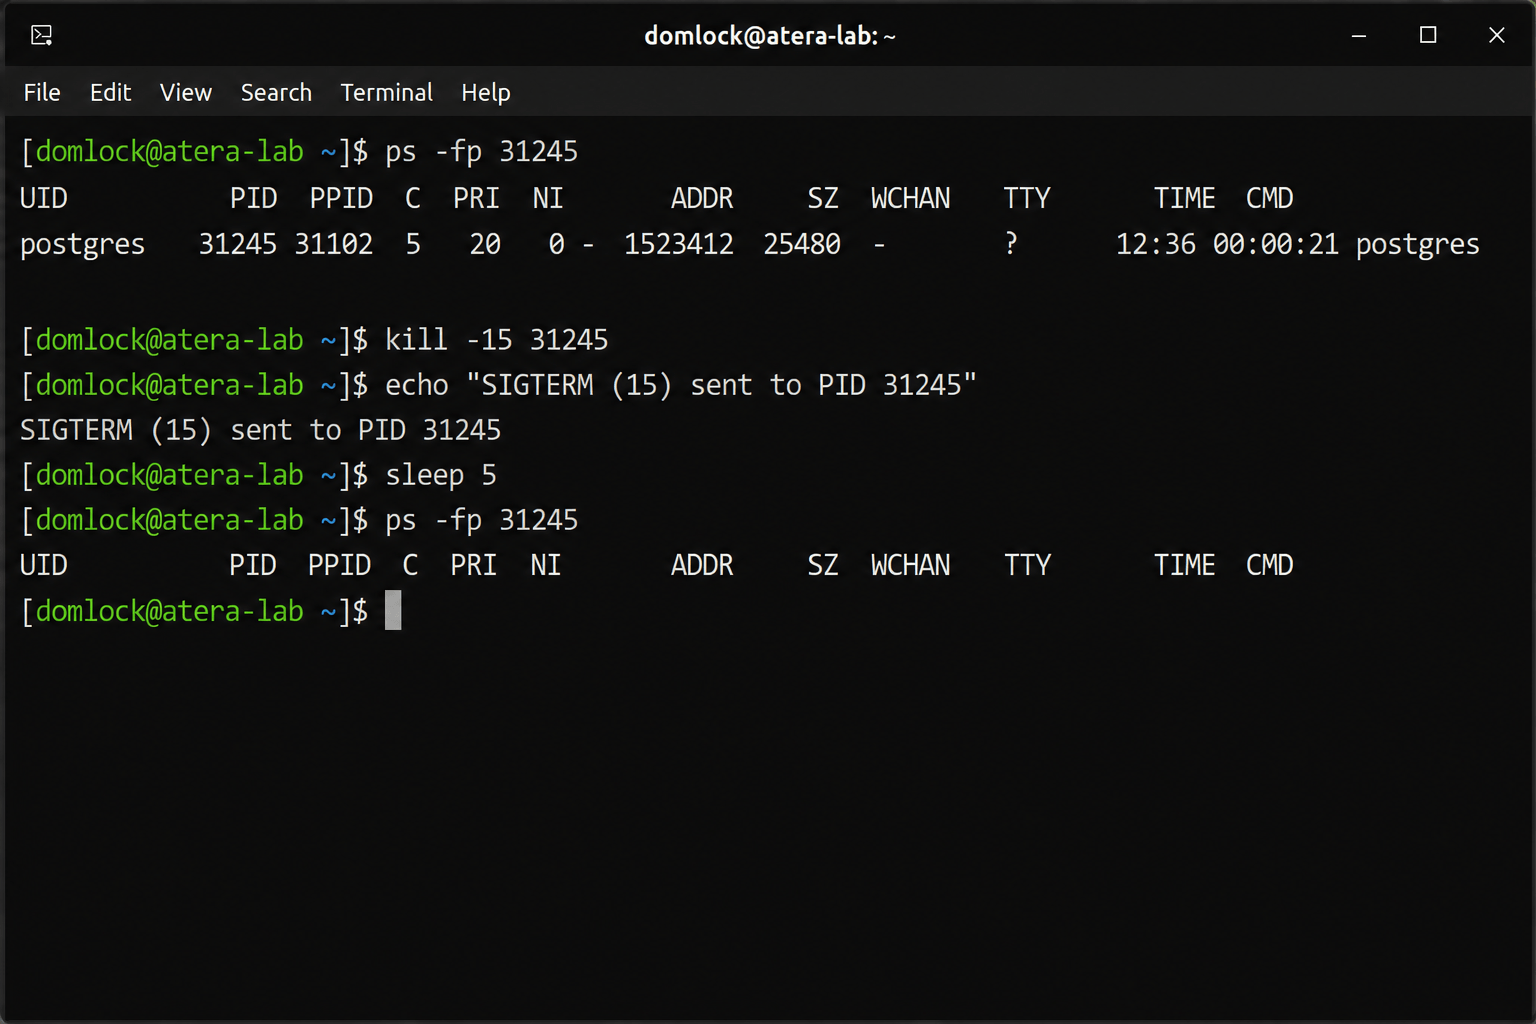
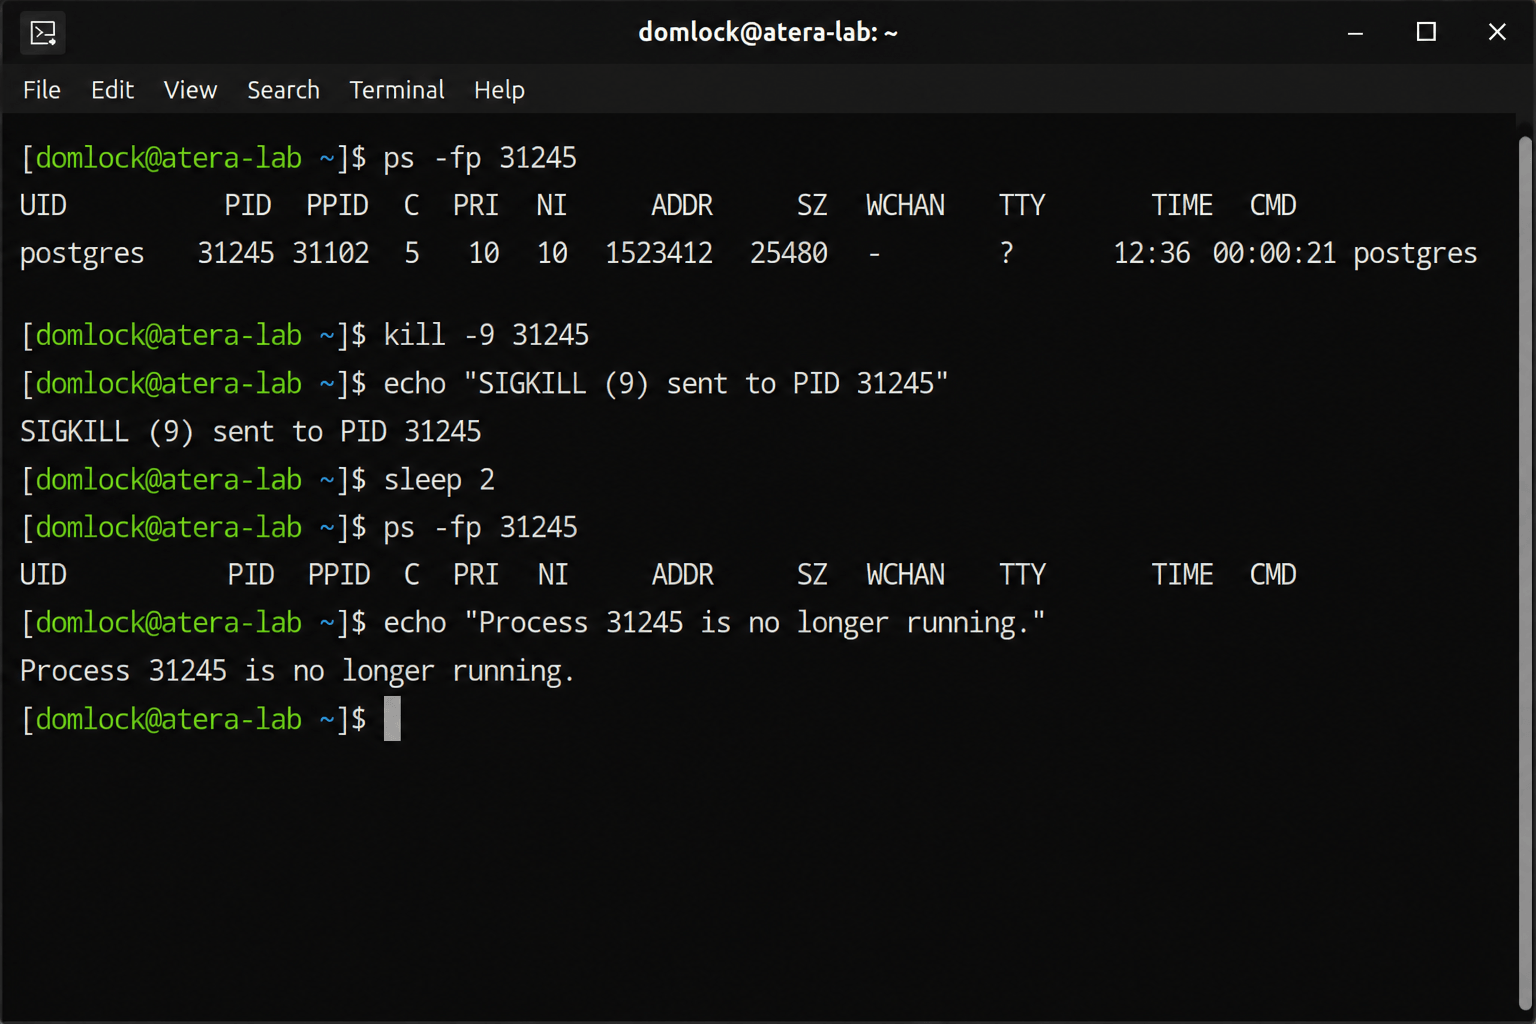
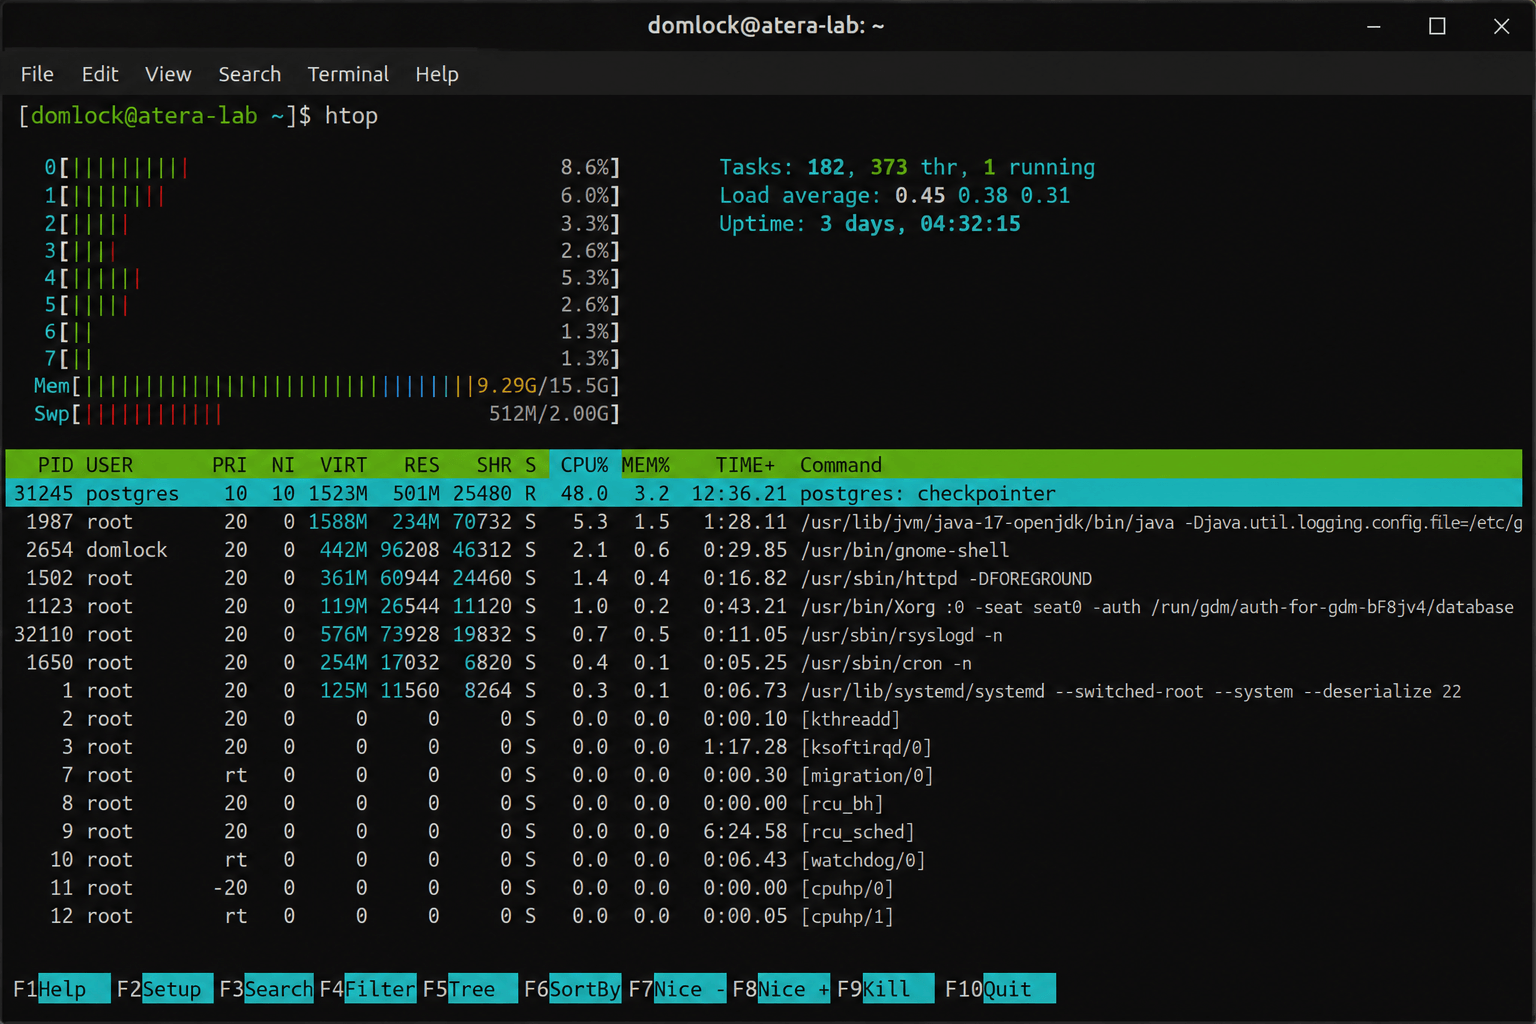
High CPU usage on a process isn’t automatically a fault. Plenty of production incidents have been caused by killing a database maintenance job that was doing exactly what it was supposed to do.
vmstat for separating CPU scheduling from memory swapping
Use this when a system “feels slow” and you need to know quickly whether the cause is CPU load, memory pressure, or storage; before chasing the wrong resource.
Run
vmstat 1to refresh every second, and ignore the first line, which is a boot-time average rather than current activityCheck
si(swap in) andso(swap out): Healthy systems report 0 for both; rising values mean Linux is actively paging memory to disk
Check
us(user CPU),sy(system CPU), andid(idle): Highidmeans the CPU isn’t your bottleneck, it’s whatever else looks busy
Check
wa(I/O wait): A high value means the processor is idle while waiting on storage, which often points to slow or saturated disks rather than a CPU problem
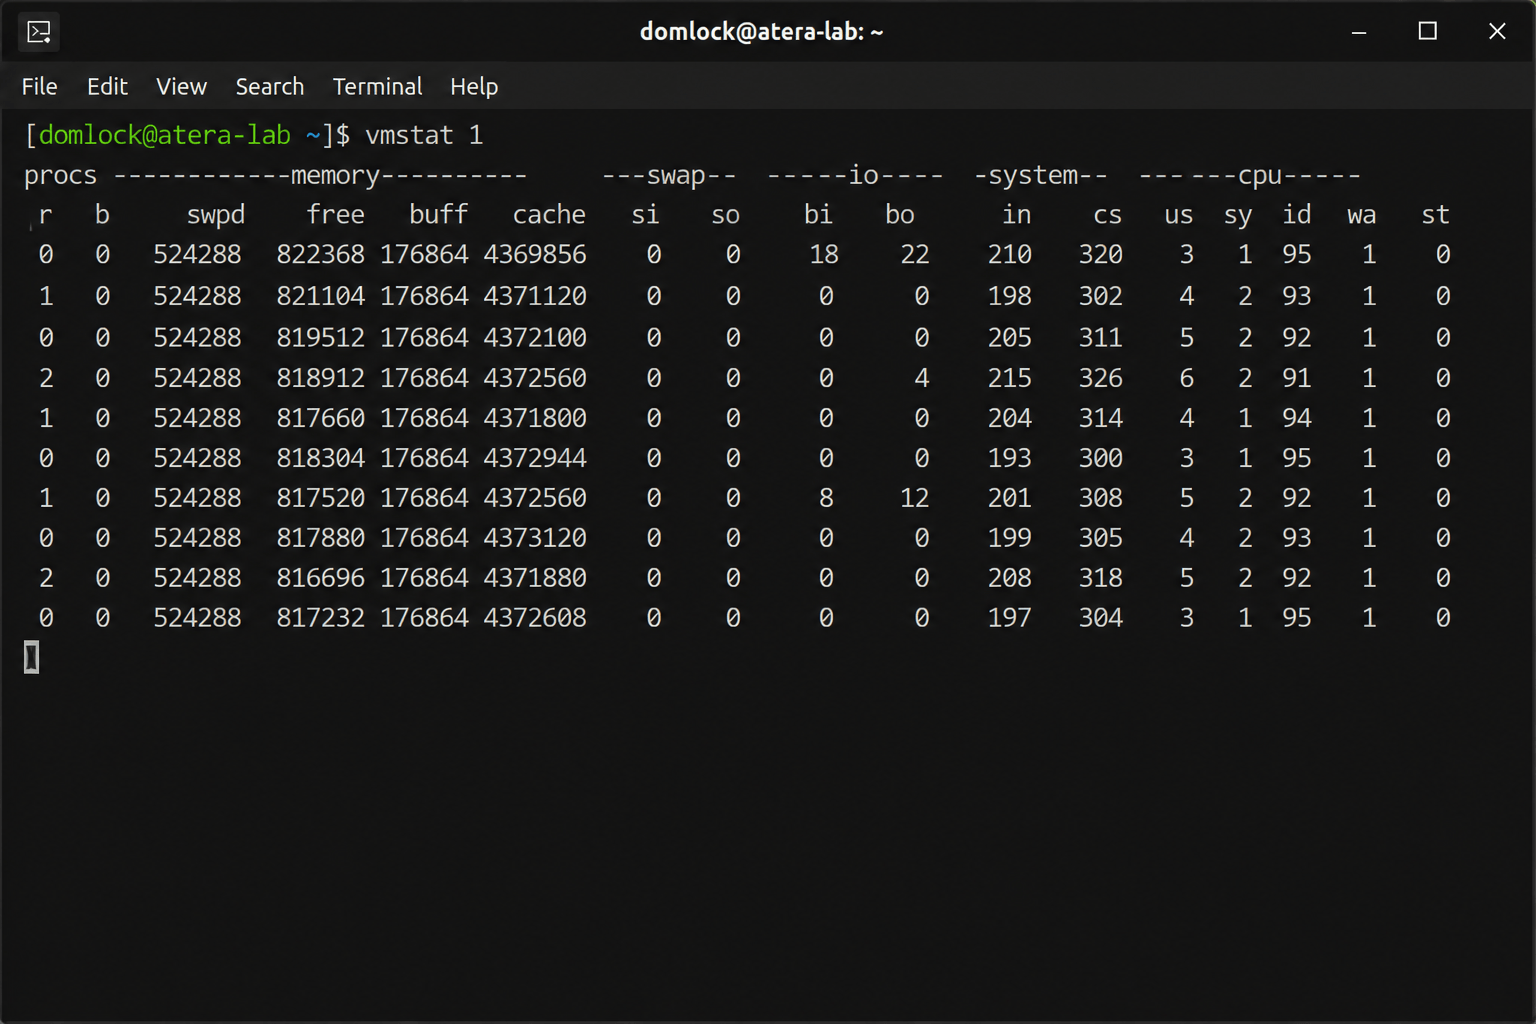
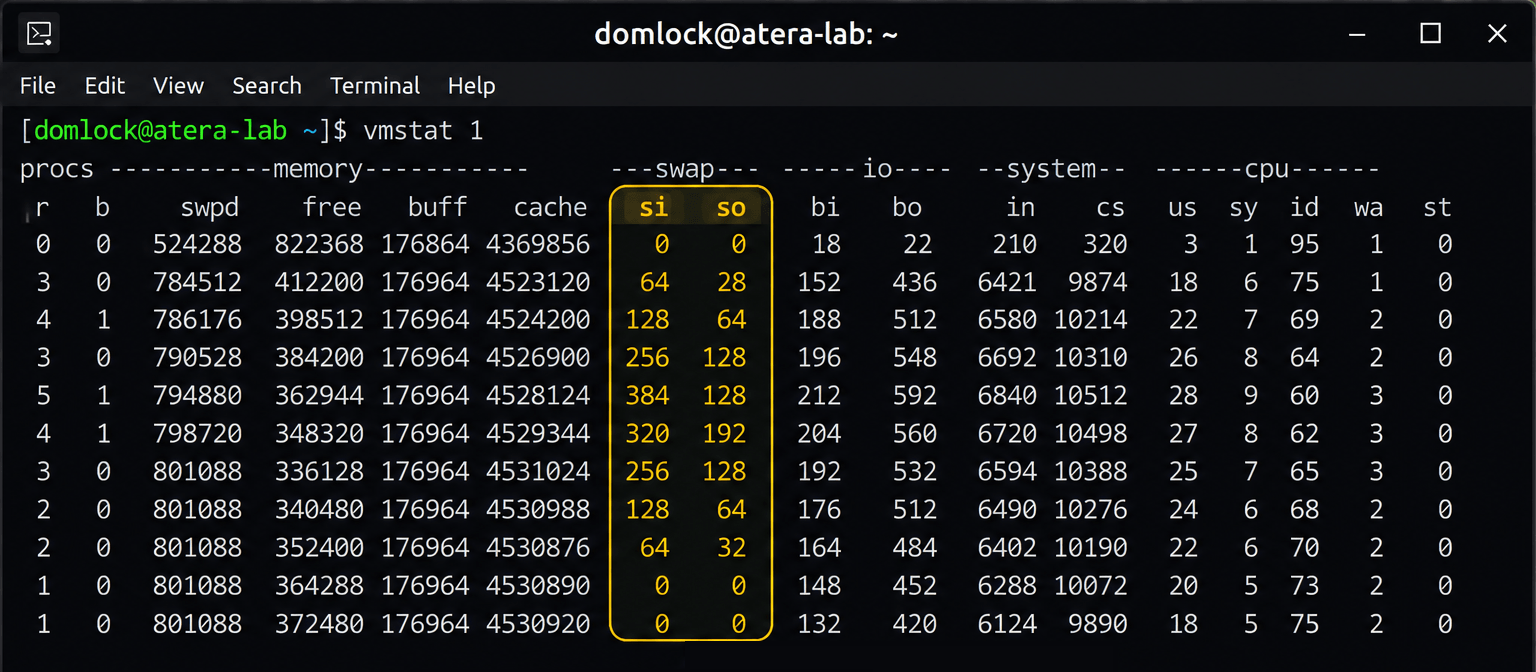
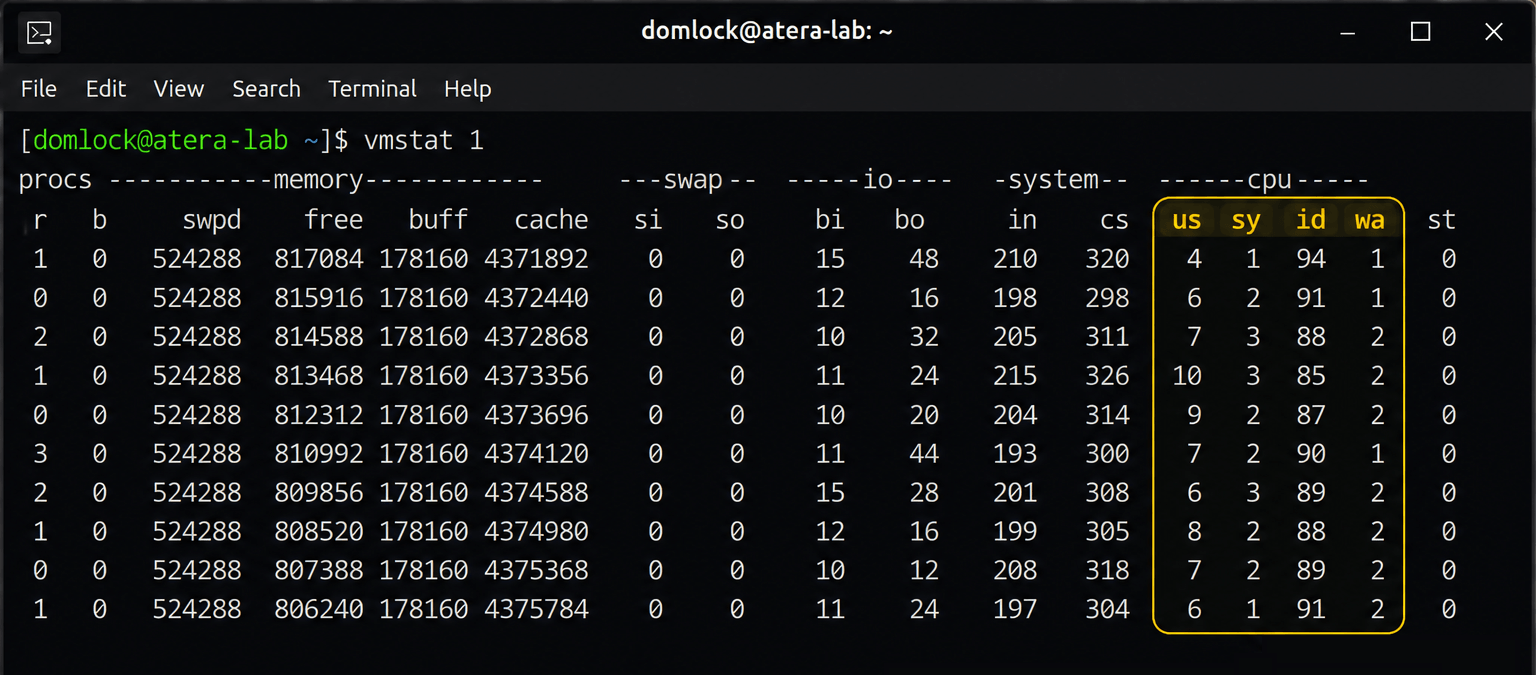
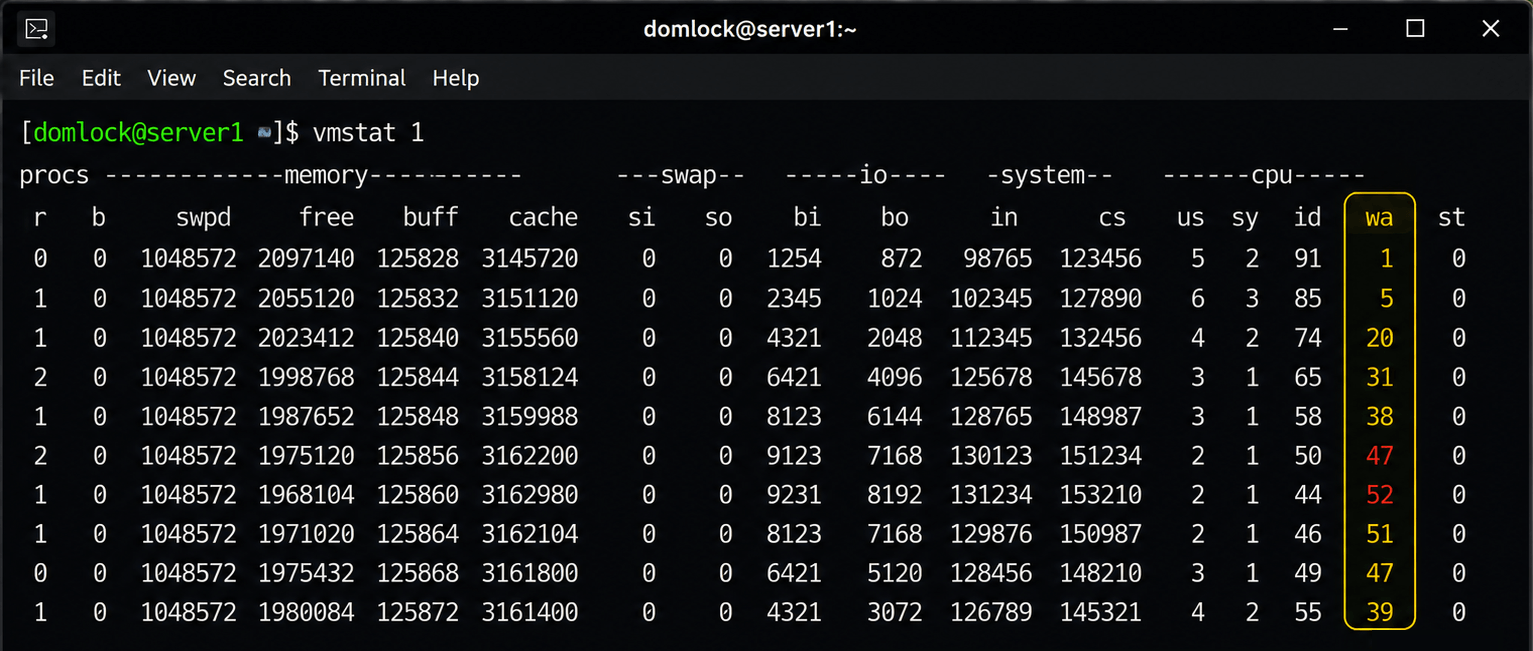
Correlate the columns rather than reading any one in isolation. For example:
- High
uswith lowwaand no swapping points to a CPU-bound workload - High
si/sopoints to memory pressure - High
wapoints to a storage bottleneck
Pro tip: CPU utilization below 20% doesn’t rule out a performance problem. Plenty of “the CPU is overloaded” reports turn out to be storage latency once vmstat is actually checked.
iostat for isolating storage bottlenecks
Use this once CPU and memory look normal but an application is still sluggish. Storage is usually the next place to look.
Run
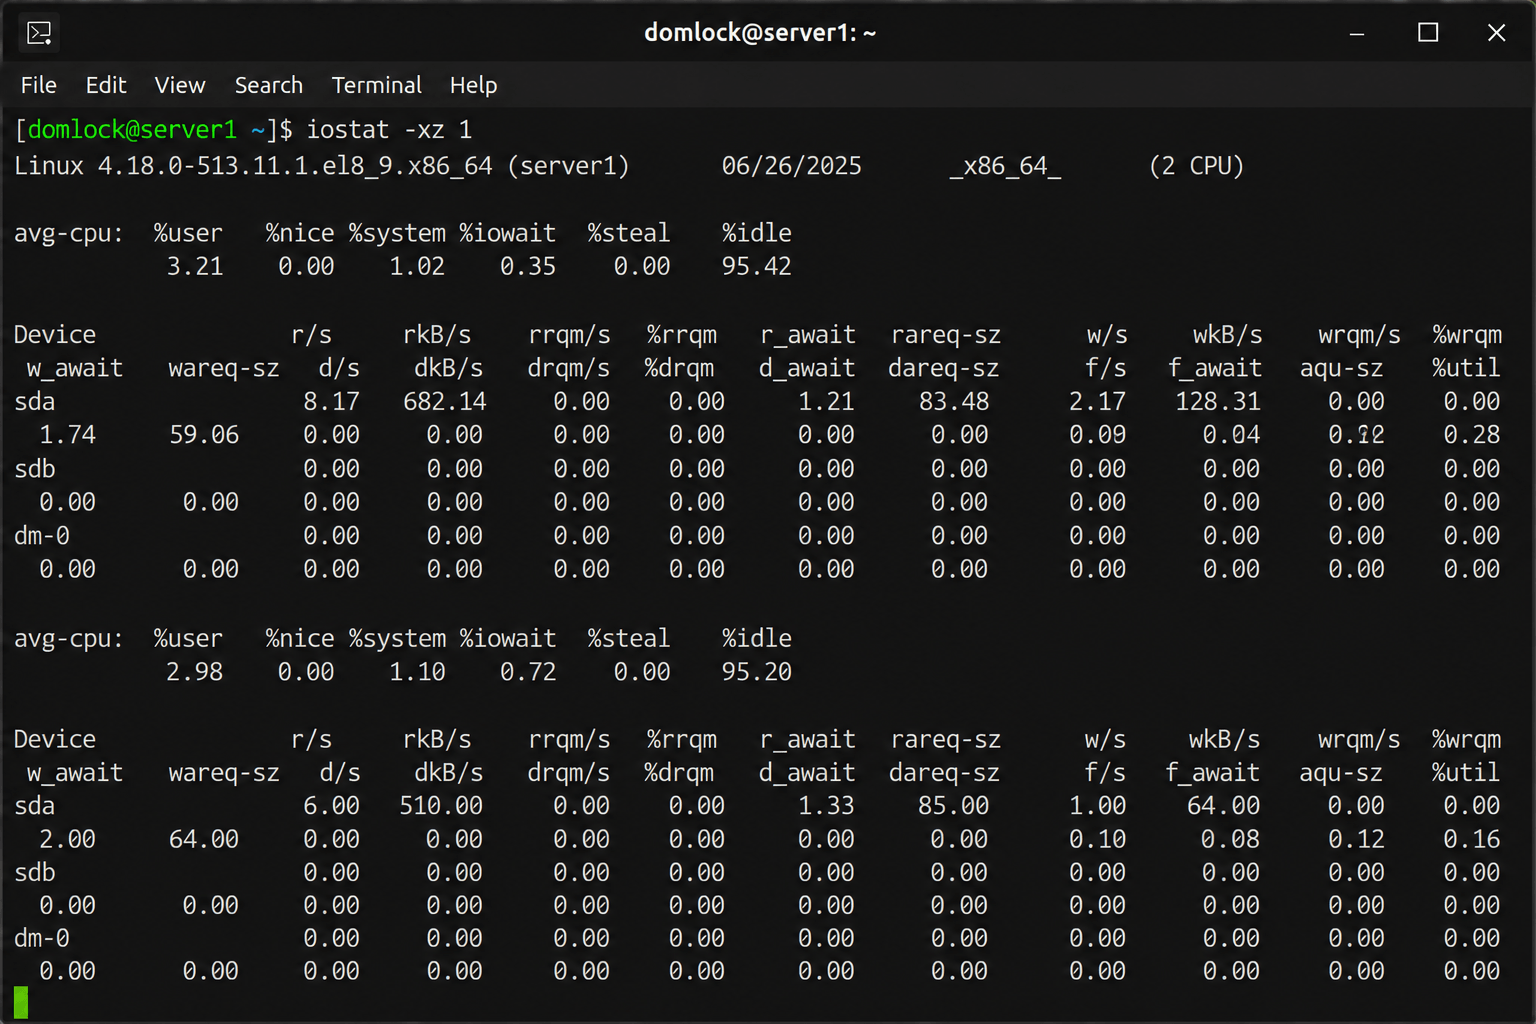
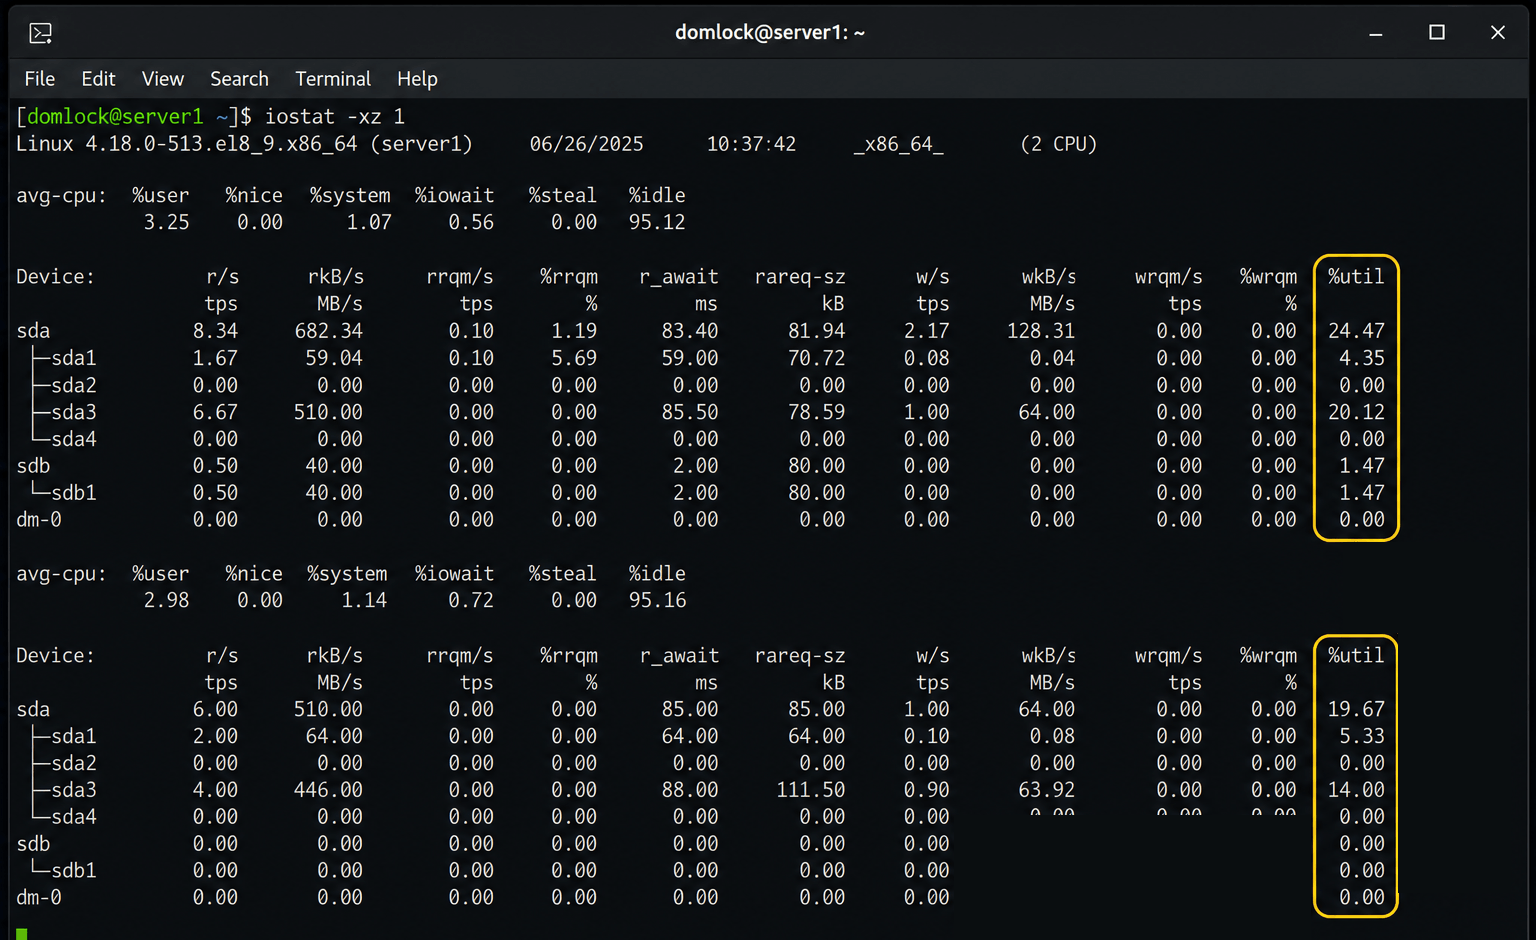
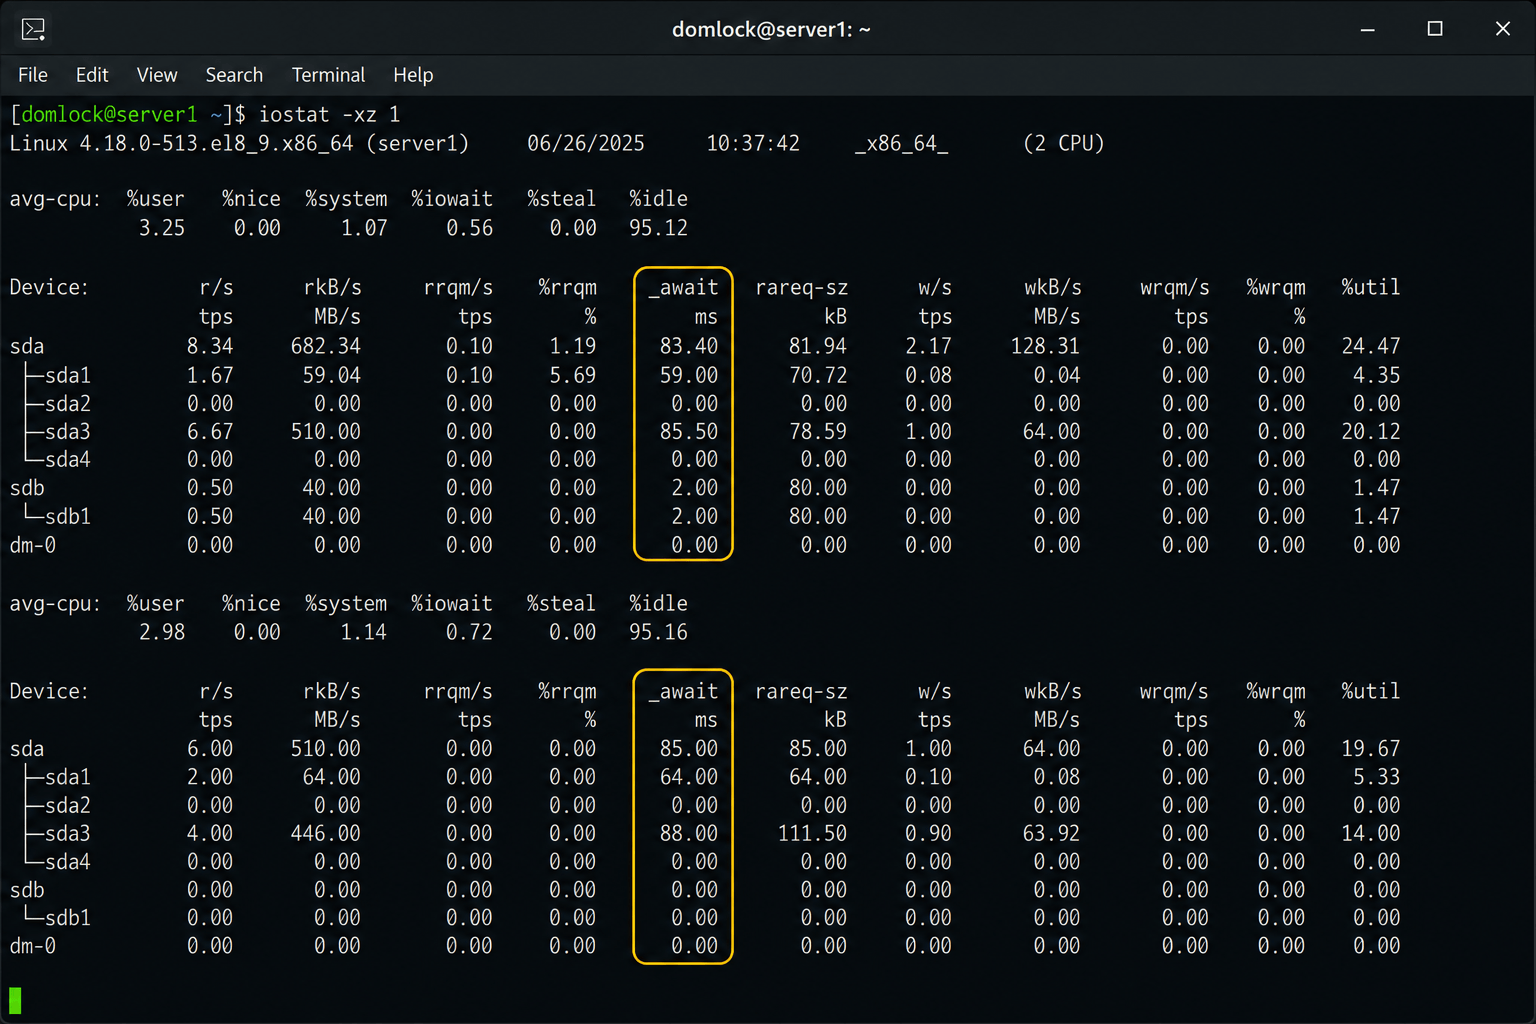
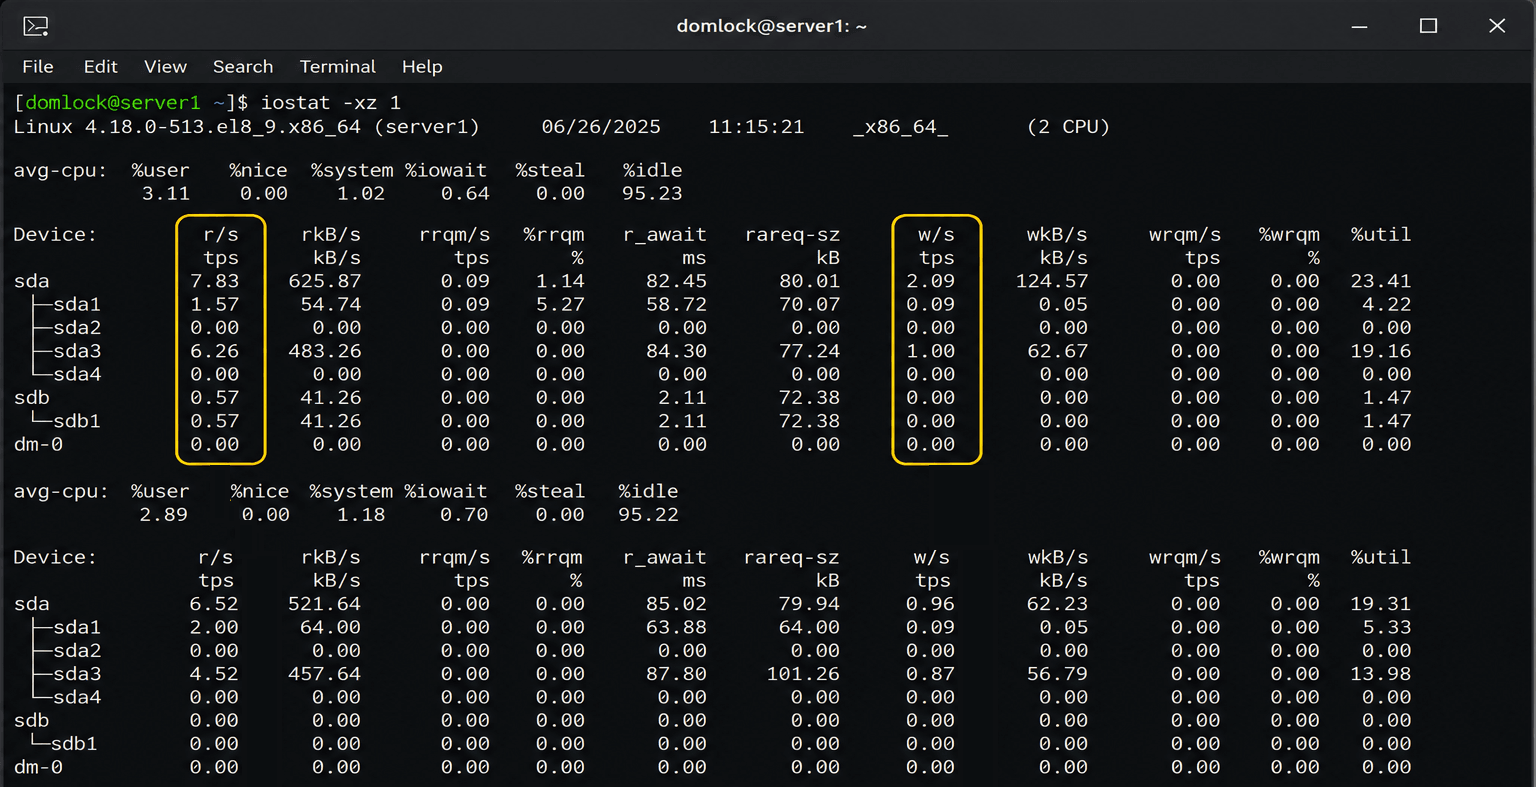
iostat -xz 1for extended, per-second statistics with inactive devices hiddenCheck %util: Below 50% is generally healthy, 70 – 80% warrants a closer look, and values near 100% mean storage is likely saturated

Check await, the average time spent waiting on storage operations: Rising latency usually hurts application performance more than raw throughput does
Check
r/sandw/sto determine whether the workload is read-heavy, write-heavy, or balanced
- Cross-reference what you’re seeing with
top,vmstat, application logs, and any backup schedule before concluding storage hardware itself is at fault. A spike during a scheduled backup is expected; the same spike during business hours isn’t
» Worried about failing storage? Here’s how to check hard drive health and check SSD health
ss or netstat for tracing socket and connectivity failures
Use this when an application can’t establish connections or is dropping packets. Work outward from the application itself rather than assuming it’s a network problem.
Run
ss -tulnpto confirm the application is actually listening on the expected port, IP, and processRun
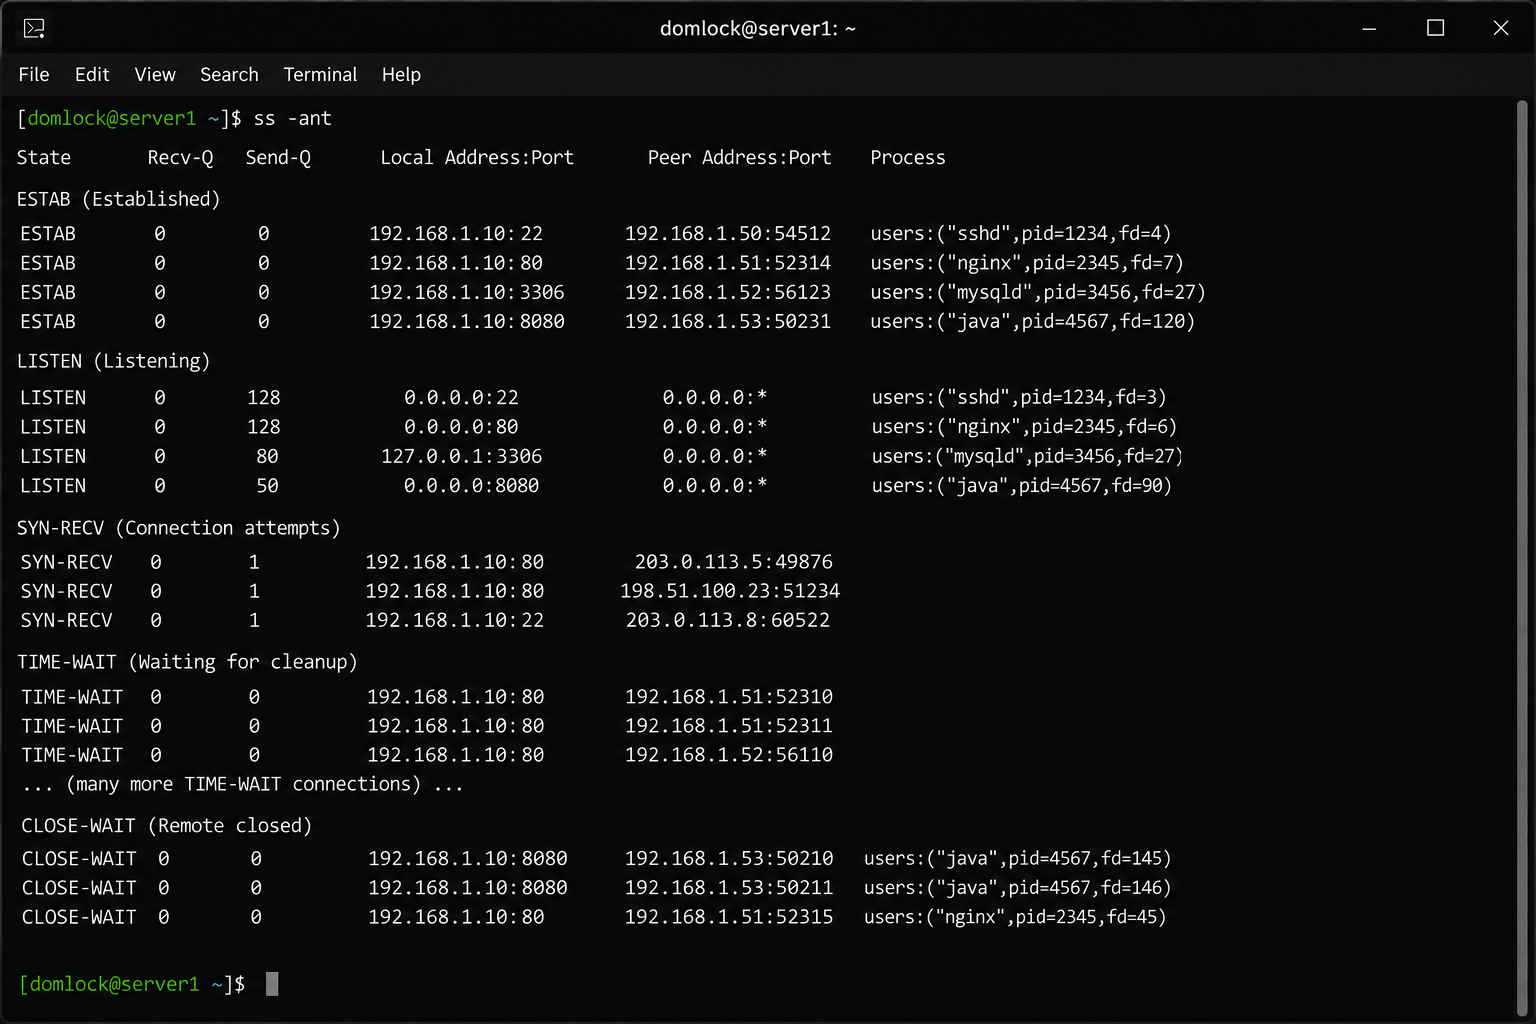
ss -antto review connection states: Watch for a large number of connections stuck in the same state (SYN_RECV,TIME_WAIT,CLOSE_WAIT), which usually points to something specificCheck the firewall with
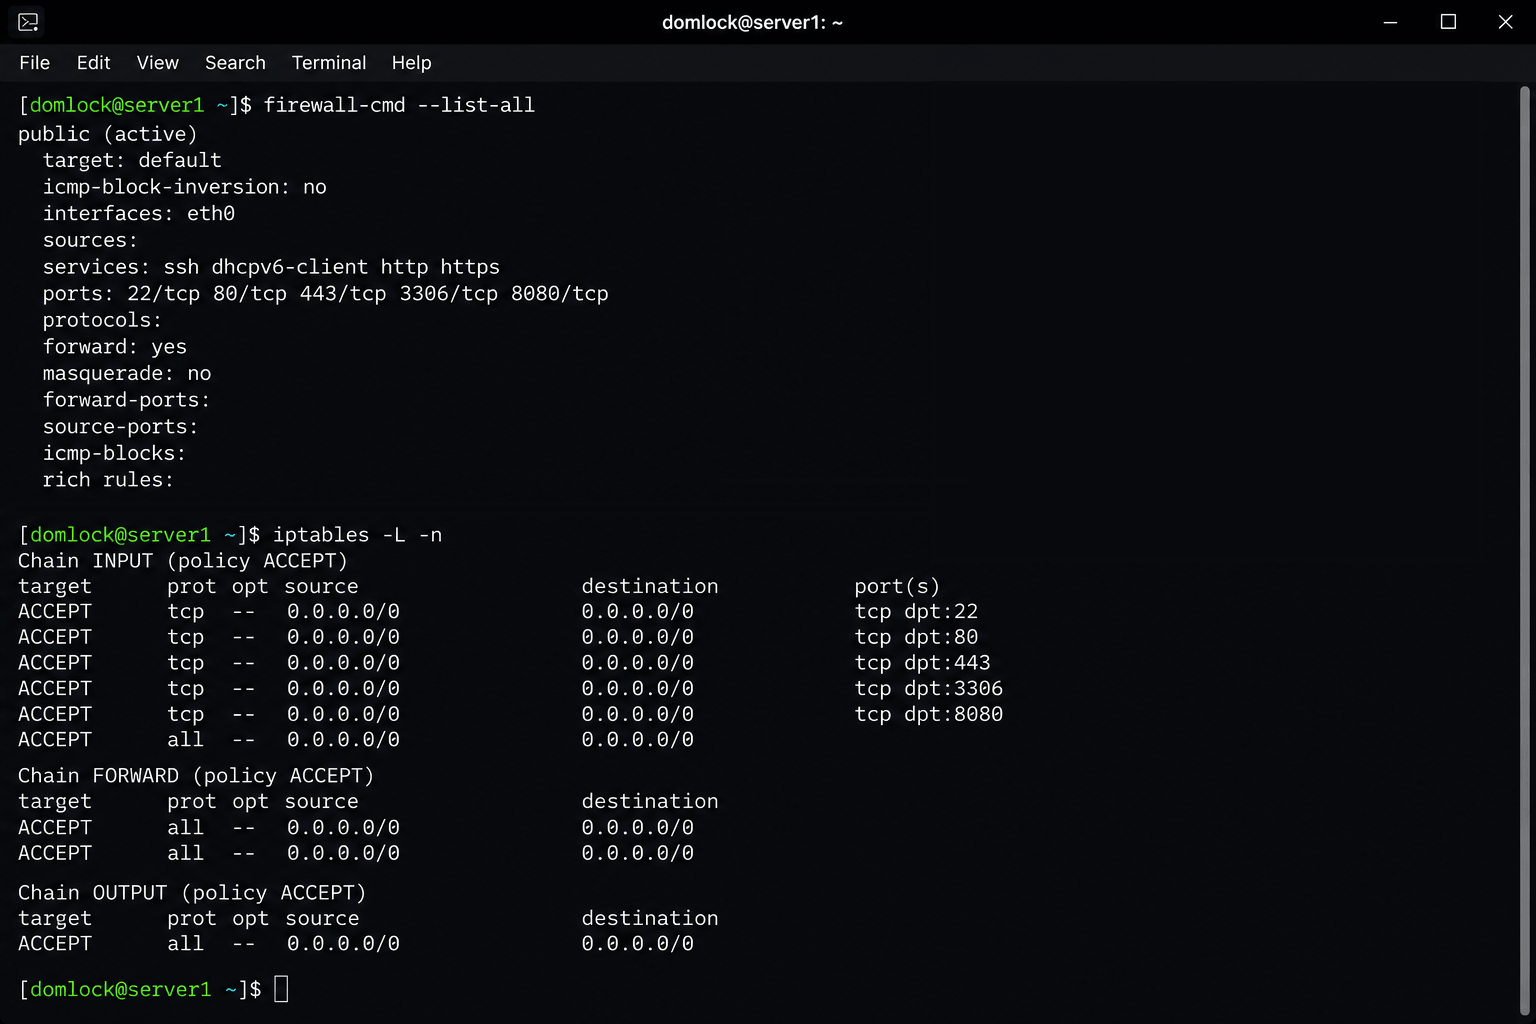
firewall-cmd --list-alloriptables -L -nto confirm the required port and zone are actually permittedConfirm DNS resolution with
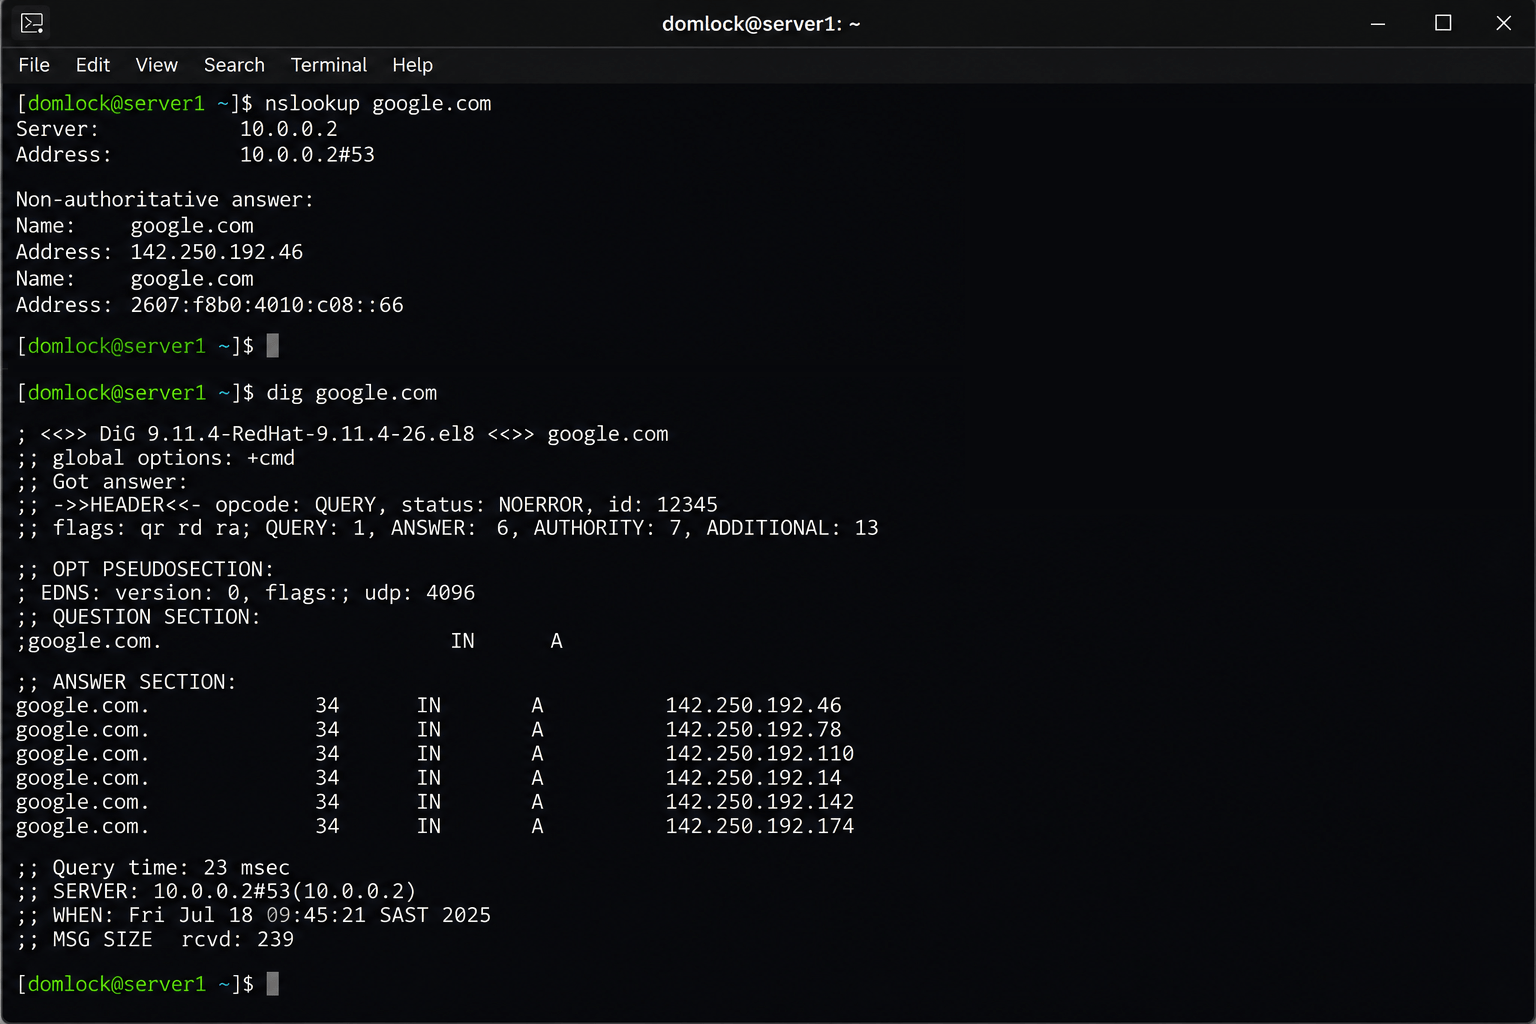
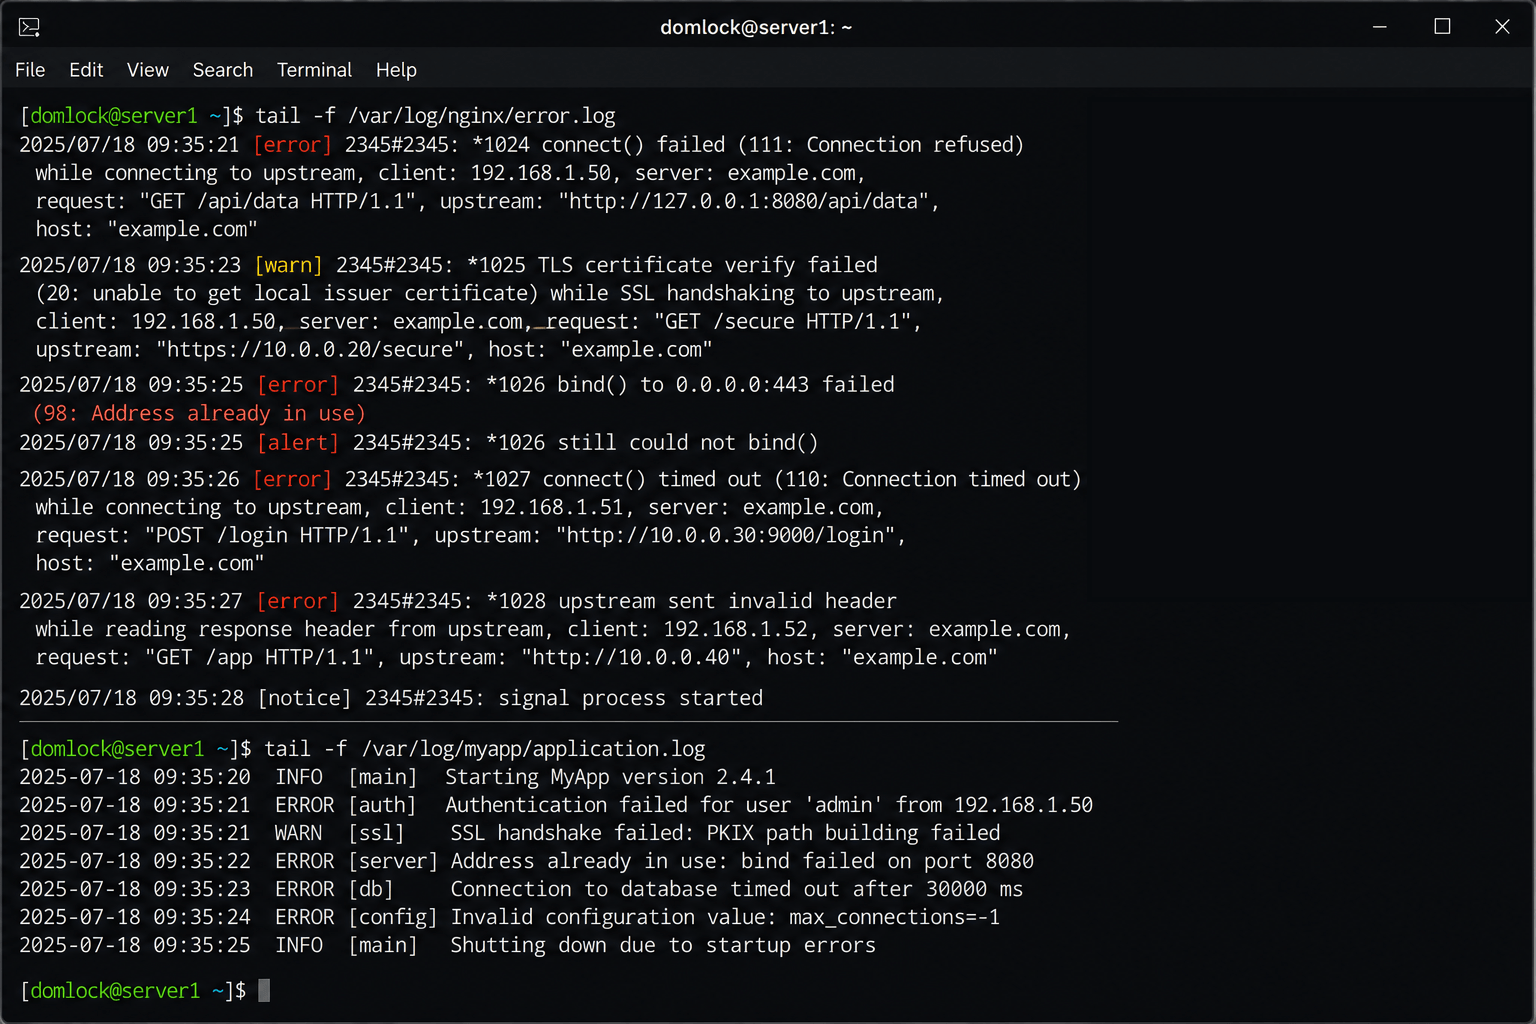
nslookupordig: An application can look broken over the network when the real failure is name resolutionReview the application’s own logs for authentication failures, certificate issues, socket binding errors, or timeouts, which often explain the failure faster than network troubleshooting alone
- Where
ssisn’t available,netstat -plantornetstat -tulnpprovide the equivalent listening and connection information
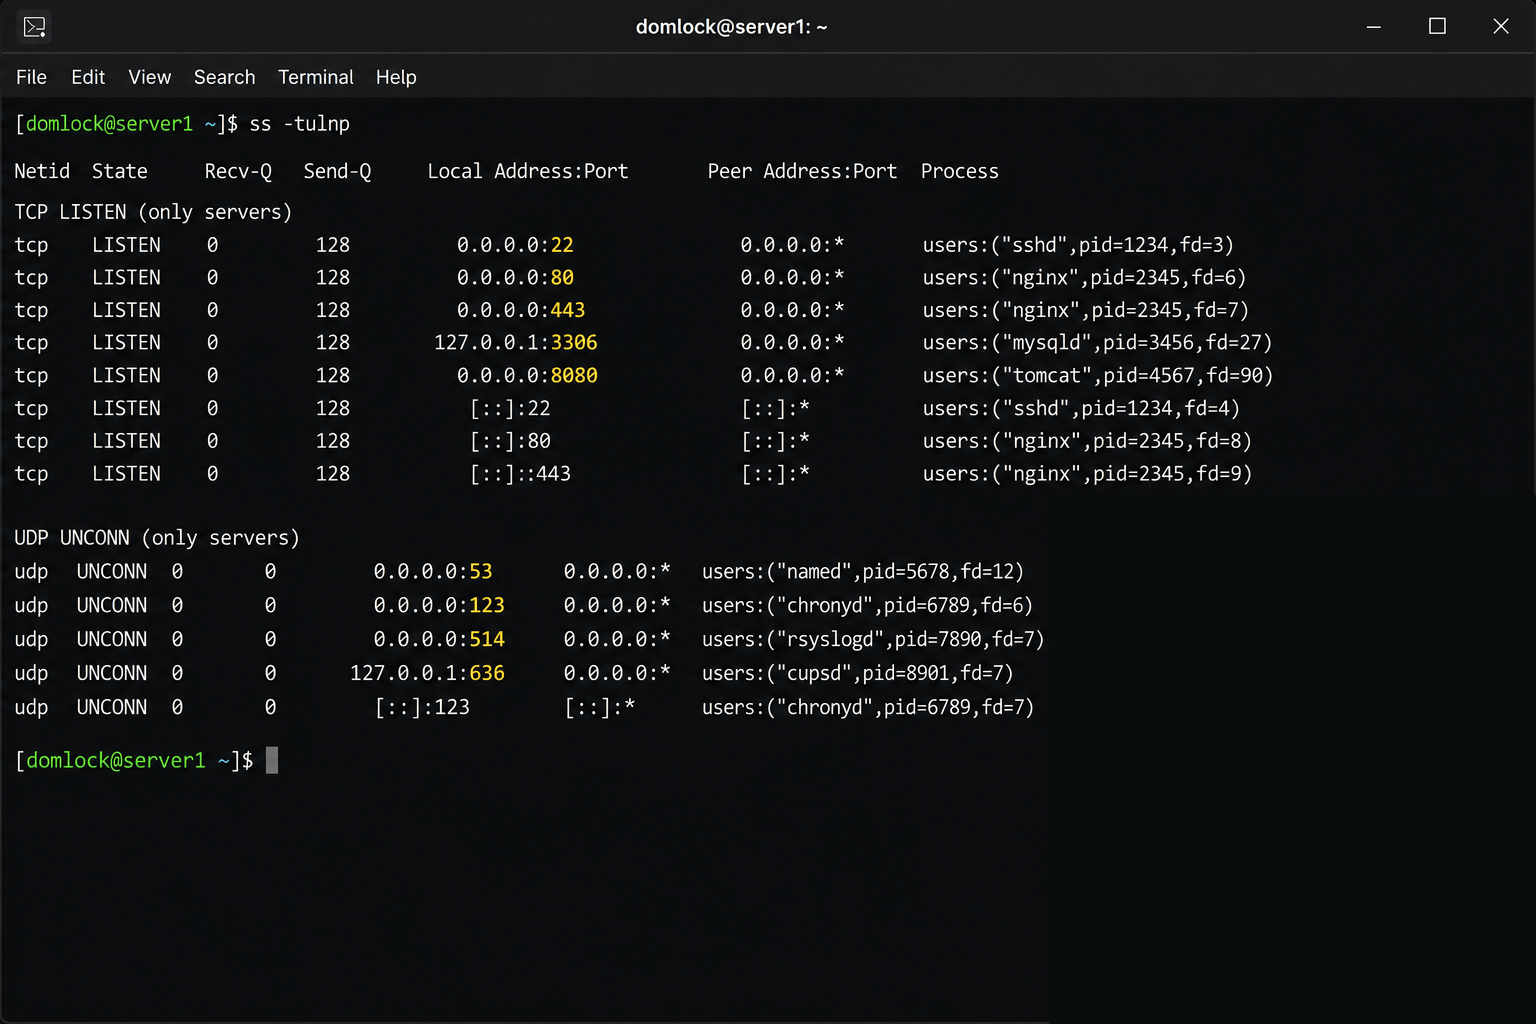
Plenty of assumed network performance incidents turn out to be an application that never restarted successfully after an update, and ss -tulnp would have shown nothing listening within seconds.
Pro tip: Running any one of these commands against a single struggling server is a five-minute job. Running the same diagnostic across a few hundred endpoints by hand isn’t. For that, Atera’s remote scripting execution through the RMM platform lets you push the same df, vmstat, or iostat check across selected devices or device groups on demand, without needing a scheduled job or an alert condition to trigger it first. And if you need something more complicated, like running all the checks across your entire network, AI Copilot can help you generate the script from simple natural language queries.
» Learn more about installing the Atera Linux Agent
How to make monitoring sustainable and proactive
Diagnosing a problem once it’s already happening is only half the job. The other half is making sure you hear about it before a user does, which doesn’t require anything more than the tools already covered here:
A single snapshot from top or vmstat tells you what’s happening right now, but it won’t tell you whether today’s load average is normal or a warning sign. For that, you need a history to compare against:
sysstat(which includessar) logs CPU, memory, and I/O data automatically in the background and is light enough to run continuously without becoming a resource problem itselfhtopandbtopare better suited to active, in-the-moment investigation, with a more readable, color-coded view of the same datatopprovides.- For anything closer to a dashboard,
Netdatacollects and visualizes this data in a browser in real time, which is useful when you want a historical view without building one yourself
Automating threshold-based alerts
Once you know what a healthy baseline looks like, the next step is a simple script and a scheduler to check it continuously and flag you the moment something crosses a line worth investigating so you don’t have to:
- Write a health-check script (or get AI Copilot to do it) that checks the resources most likely to cause an incident, including CPU utilization, available memory, swap usage, filesystem utilization, critical service status, and disk I/O errors. Have it fire a notification once a value crosses a threshold you set (for example, root filesystem utilization above 85%).
- Schedule the script with
crontab -e, adding an entry such as*/5 * * * * /usr/local/bin/system-health-check.sh; Five minutes is a reasonable starting interval; critical production systems may warrant tighter scheduling than a dev or test box. - Configure how the alert actually reaches you. Desktop systems can use
notify-senddirectly; headless servers need it routed somewhere a human will actually see it, such as email, Slack, Teams, an SMS gateway, or a monitoring platform. Whatever the channel, the notification should state which server, which resource, the current value, the configured threshold, and when it happened, so no one has to log in just to find out what triggered it. - Verify the alert before trusting it. Deliberately push the check past its threshold and confirm the script runs, the notification arrives, and it actually contains the information you configured, since an alert that’s never been tested is just a script you’re hoping works.
For technicians managing more than a handful of Linux machines, Atera’s RMM extends this same discipline with centralized threshold-based alerting for CPU load, memory usage, disk usage, and device availability, so the notification arrives on whatever platform you use without needing a script deployed and scheduled on every box individually.
Know your baseline before you need it
Every command in this guide removes a little of the guesswork. df tells you exactly which filesystem is full, vmstat tells you whether you’re CPU-bound or swapping, and iostat tells you whether storage is actually the bottleneck or just a convenient scapegoat. But running this workflow on one server during an incident and running it across two hundred servers every day are two very different jobs.
Atera’s RMM makes it easier to manage for IT teams and MSPs managing more than a handful of Linux machines. Threshold-based alerts for CPU load, memory usage, and disk space mean you find out about a filling filesystem from a notification, not an angry user’s ticket.
» Take control of your Linux monitoring process with Atera’s free trial
Related Articles

How to reduce alert fatigue across your IT team
Your technicians aren't ignoring alerts because they're careless. They're ignoring them because most alerts have taught them to. Once the stream stops being trustworthy, real failures slip past with the noise. Fixing it means deciding what deserves an interruption, tuning out transient spikes, collapsing alert storms, and automating the fixes you've run a hundred times.
Read now
How to close the IT skills gap on your team
Course completions don't close skills gaps. Technicians finish the training, then hand the first unfamiliar failure straight back to a senior engineer. Real capability gets built on live tickets, incidents, and maintenance windows, with guidance that fades as competence grows.
Read now
How to calculate cost per ticket (and why most teams get it wrong)
Most cost-per-ticket figures are wrong before anyone reads them. Missing overhead, tickets that were opened but never closed, spam and duplicates padding the count, and one month's costs divided by another month's tickets all make support look cheaper than it is. Fix both sides of the division and the number finally shows where technician time and money actually go.
Read now
How to prepare for a software license audit
A vendor audit notice doesn't wait for you to get organized. It demands proof, right now, that every install matches every entitlement you've paid for, and most IT teams find out the hard way how much they don't actually know about their own environment. Getting audit-ready before the letter arrives is the difference between negotiating from strength and paying for months of scrambling.
Read nowEndless IT possibilities
Boost your productivity with Atera’s intuitive, centralized all-in-one platform