
Generate summary with AI

Managing a network of endpoints and servers means you’re only as fast as your slowest drive. While SSDs have revolutionized performance, they aren’t immortal. They have a finite lifespan dictated by how much data they write and the environments they live in. If you wait for a drive to disappear from the BIOS before you take action, you’ve waited too long.
In this guide, we’ll break down how to spot the early warning signs of SSD degradation across Windows, Linux, and macOS, and how to build a proactive strategy that keeps your hardware and your data safe.
» Here’s the 7 best enterprise SSD’s you should know about
What you need to know about SSDs
An SSD is a storage device that uses NAND flash memory to store data persistently, unlike traditional hard disk drives (HDDs) that rely on spinning platters and mechanical heads. Because SSDs have no moving parts, they offer significantly faster read/write speeds, lower latency, and better resistance to physical shock.
Several operational factors can significantly speed up the wear and tear of NAND cells:
- High Write Amplification (WA): When an SSD receives small or random writes, the controller must often move existing data to new blocks before erasing old ones. This internal data movement multiplies the number of program/erase (P/E) cycles, accelerating wear.
- Insufficient Overprovisioning (OP): Overprovisioning provides spare blocks for wear leveling and garbage collection. Without enough spare space, the controller must recycle blocks more frequently, which increases write amplification and causes uneven wear.
- Thermal stress: Operating above recommended temperature thresholds increases error rates. This forces the controller to perform more error corrections and read retries, which stresses the NAND cells and shortens data retention.
- Power instability: Unexpected power loss during write operations can cause data corruption. The controller must then perform recovery routines, which increases P/E cycles and wear. Drives without power-loss protection are especially vulnerable.
- Inadequate TRIM or poor garbage collection: Without TRIM commands, the SSD cannot identify which blocks are no longer in use. The controller ends up moving unnecessary data during garbage collection, significantly increasing write amplification.
Take note: Even with proactive monitoring, some failure scenarios occur instantly with no prior SMART warnings. A sudden NAND chip failure can make a drive read-only or inaccessible immediately.
Organizational risks that impact operations
Organizations face several critical risks from data loss to unexpected downtime that can disrupt operations, inflate costs, and compromise contractual obligations.
- Data loss: Poorly managed backups can lead to permanent loss of critical information.
- Downtime: Failures of servers or endpoints can halt business operations and impact productivity.
- Costs: Emergency hardware replacements and recovery services can be expensive and disruptive.
- Breach of contract: Inability to meet uptime guarantees for enterprise applications can violate contractual obligations.
» Check out the best portable SSDs for IT departments
Mitigation and contingency planning for storage failures
Implementing a strategy before a failure occurs is the only way to minimize the impact of sudden hardware loss. To protect your infrastructure, you should establish clear protocols that ensure data integrity and rapid recovery:
- Backup management Create backup strategies that are aligned with how critical your data is. This involves setting higher frequency backup windows for your most sensitive data and regularly validating that restore procedures actually work.
- Redundant storage solutions: Use RAID configurations to ensure that a single drive failure doesn’t cause immediate data loss or take a system offline.
- System snapshots: Use short term snapshots of active systems to recover recent changes quickly if a drive becomes read only or corrupts metadata.
- Disaster recovery planning: Implement a comprehensive disaster recovery plan with specific guides for hardware failure, data restoration, and system recovery. This ensures business continuity even when a critical component fails without warning.
» Learn more about hardware updates
How to assess SSD health on Windows 10 & 11
Windows provides a mix of user-friendly menus and deep-dive command-line interfaces. While Windows 11 has a more robust graphical interface, Windows 10 users must rely more heavily on PowerShell and legacy tools for the same level of detail.
Method 1: Settings
This method is best suited for everyday users who want a quick confirmation that their SSD is installed correctly and recognized by the system. It requires no technical knowledge and uses the standard Windows interface, making it the easiest starting point.
For Windows 11, follow these steps:
1. Search “Settings” in your search bar and click “open”

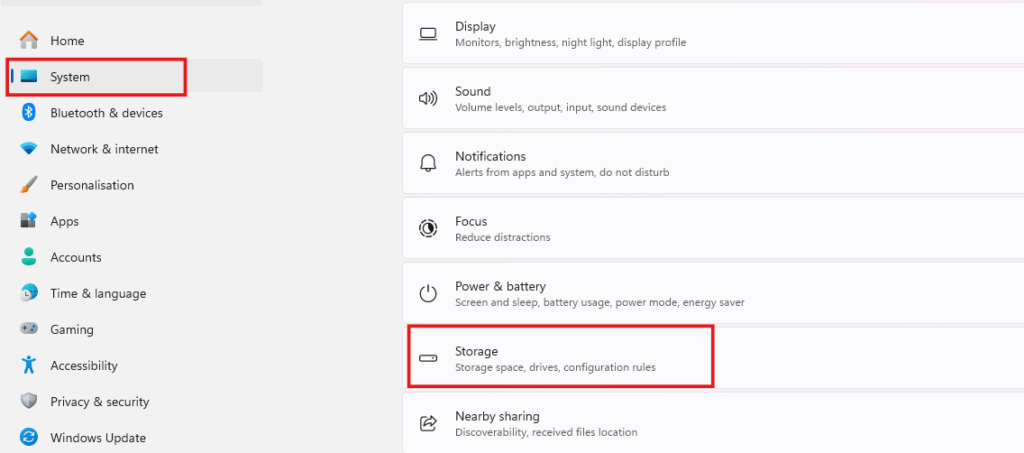
2. Navigate to System, then Storage
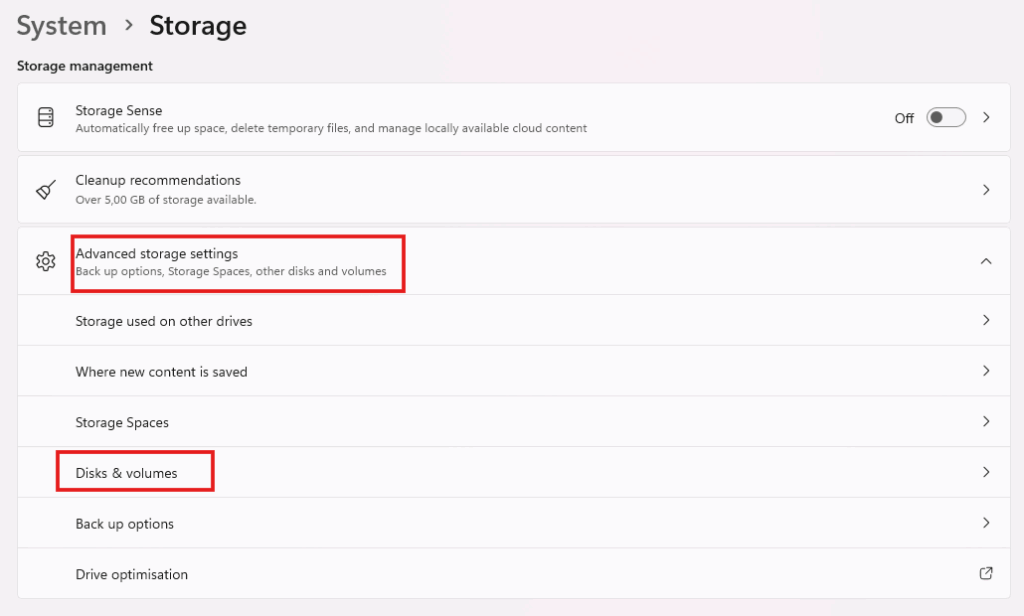
3. Select Advanced storage settings, then Disks & volumes
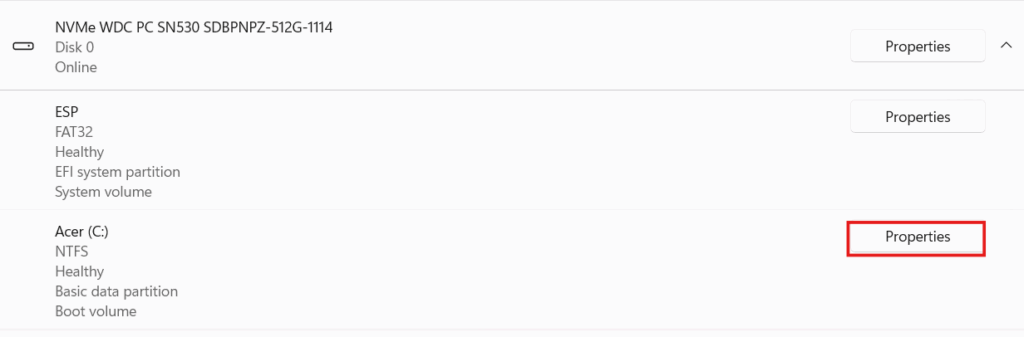
4. Choose your SSD and open Properties to view its information
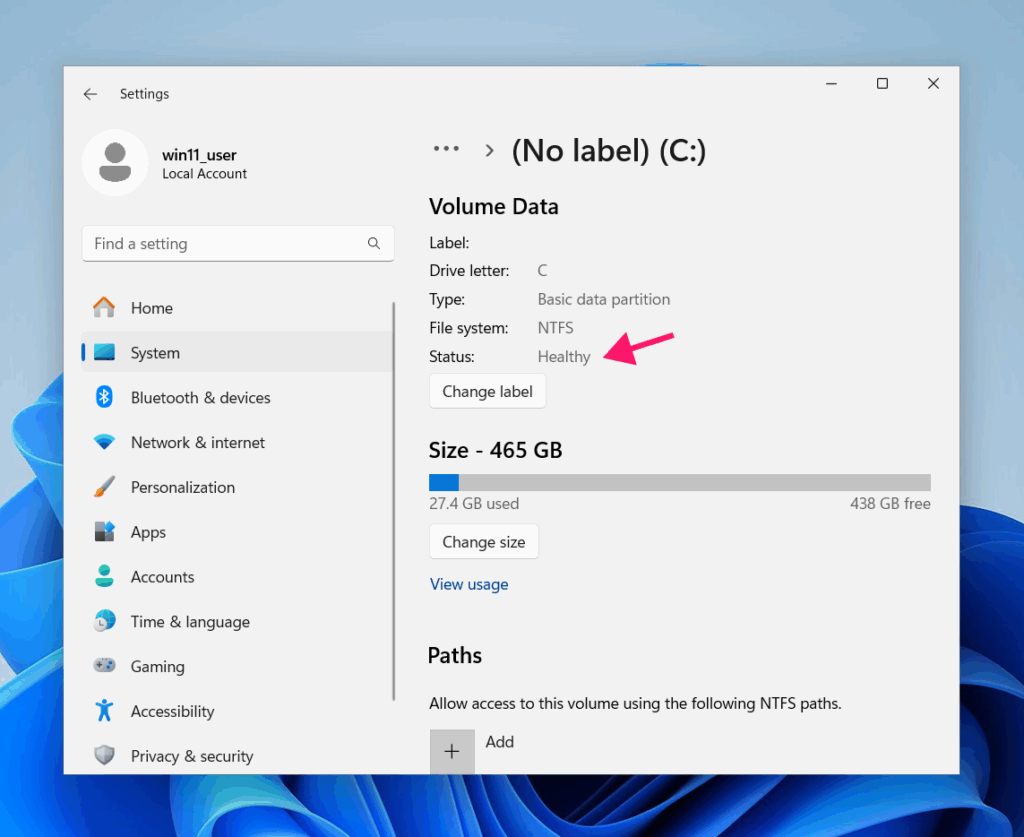
5. Check the health status and drive status fields. A healthy SSD will typically show a status such as “Healthy”, while warnings or unknown states may indicate a potential issue that needs further investigation
For Windows 10, follow these steps:
- Open Settings
- Go to System
- Select Storage to view connected drives
Windows 10 typically shows only basic information such as capacity and partitions, while Windows 11 may display additional status information depending on the drive.
Method 2: Task Manager
Task Manager is best for users who want to monitor SSD activity in real time. Instead of showing long-term health information, it displays live performance data. This makes it particularly useful when diagnosing slow performance or unusually high disk activity.
You would use this method if your computer feels slow, if applications take a long time to open, or if you suspect a program is heavily using the disk.
Follow these steps:
1. Press Ctrl + Shift + Esc to open Task Manager
2. Select the Performance tab and click the disk you want to monitor
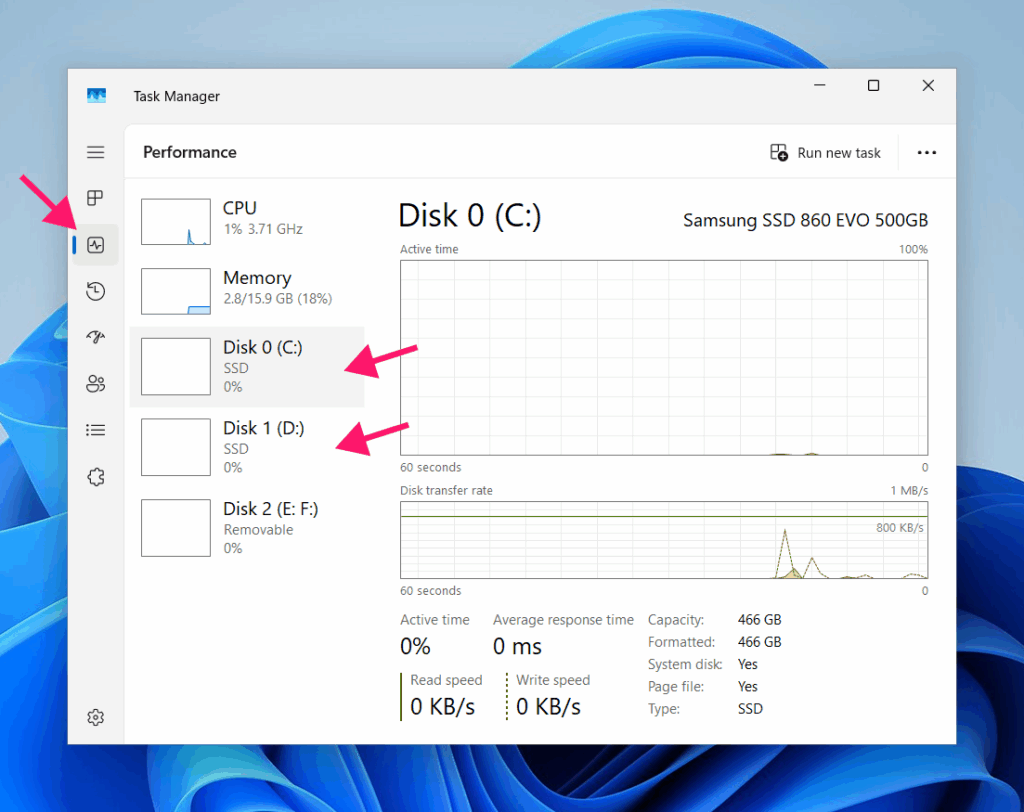
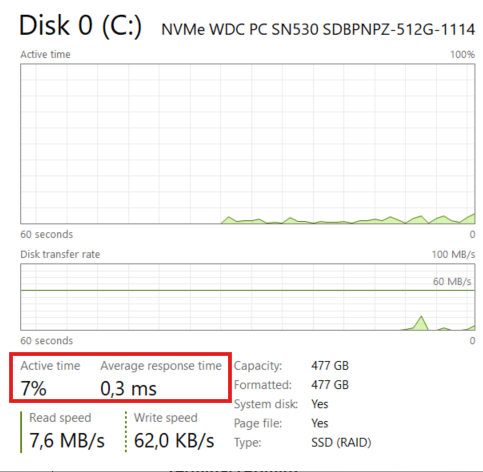
3. You’ll see metrics such as active time, read and write speeds, and response time. If the drive constantly shows very high active time with low speeds, it may indicate a bottleneck or another system issue
- Active time shows how busy the SSD is. Normal use sits below 50% with occasional spikes to 100%; constant high usage with low speeds may indicate a bottleneck.
- Read and write speeds reflect how fast data is transferred. Speeds should roughly match your SSD type (slower for SATA, faster for NVMe); consistently low speeds can signal an issue.
- Response time measures how quickly the SSD reacts. It should stay low (around 1–5 ms); consistently high latency may indicate the drive is struggling.
» See our picks for the best PC performance monitoring software
Method 3: PowerShell
PowerShell is intended for advanced users, IT administrators, or anyone performing deeper diagnostics. It allows you to retrieve technical health information from the operating system and the drive itself. This method is useful when you want more reliable health data than graphical tools provide.
Follow these steps:
1. Search “PowerShell” in your search bar and click “run as administrator”

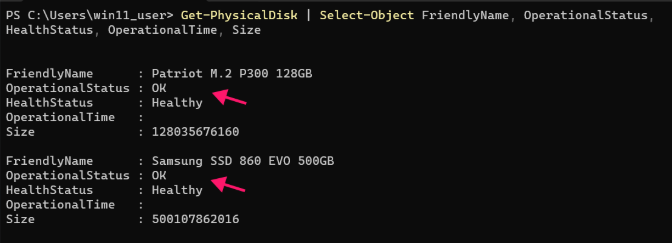
2. Run the command: Get-PhysicalDisk | Select-Object FriendlyName, OperationalStatus, HealthStatus, OperationalTime, Size
This will display key details about your SSD, including its Operational Status and Health Status, which indicate whether the drive is functioning normally or if any issues are detected
3. To check whether the drive firmware predicts a failure run the command:Get-WmiObject -Namespace root\wmi -Class MSStorageDriver_FailurePredictStatus | Select InstanceName, PredictFailure, Reason

While PowerShell is a powerful diagnostic tool, running these commands manually on every machine is not scalable. Atera’s RMM platform helps by allowing you to execute these scripts across your entire fleet simultaneously, gathering SSD health data from all endpoints into a single view.
With Atera’s AI Copilot, you can automate this further. Instead of writing complex code, you can ask the Copilot to generate specific PowerShell scripts that track SSD wear levels or temperature.
» Find out how to run PowerShell commands on a remote computer
Method 4: Event Viewer
Event Viewer is best for diagnosing hidden or intermittent hardware issues. Instead of providing performance data, it records system events and warnings generated by the operating system.
Follow these steps:
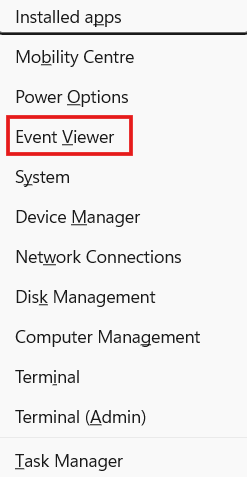
1. Press Windows + X and select Event Viewer
2. Navigate to Windows Logs, then System
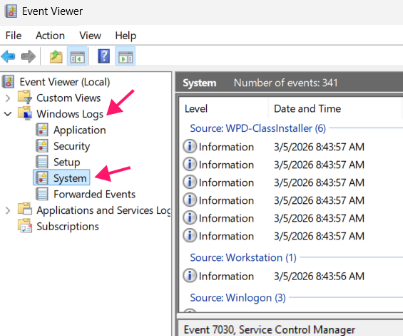
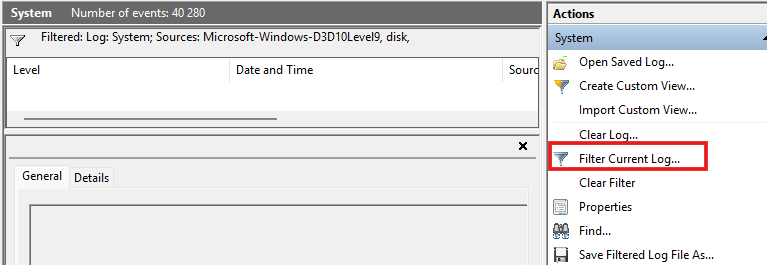
3. Use the filter option to display events from disk-related sources such as Disk or nvstor. This will show warnings, errors, and informational logs related to your SSD, including issues like read/write failures, timeouts, or hardware-related problems
Remember: A healthy drive should rarely generate disk-related hardware events. Frequent warnings or recurring errors can indicate that further investigation is needed
» Make sure you know how to view and analyze logs with Event Viewer
Method 5: WMIC (Legacy Windows 10 method)
WMIC is a legacy command-line tool that still appears in many Windows 10 environments. It’s typically used by administrators or technically experienced users who are working on older systems where PowerShell scripts may not be available.
Follow these steps:
1. Open Command Prompt as Administrator

2. Run the command: wmic diskdrive get model, size, interfacetype, mediatype, status
The command displays basic information about each drive, including its model and reported status.

» Learn the difference between PowerShell and Command Prompt
How to check SSD health on Linux
Linux gives you direct access to SSD health data through terminal tools. You’ll mainly work with SMART data, which reports the drive’s internal health and potential failure warnings.
Follow these steps:
1. Open the terminal
2. Run the appropriate command for your distribution:
- Debian/Ubuntu:
sudo apt install smartmontools nvme-cli - Fedora/RHEL:
sudo dnf install smartmontools nvme-cli - Arch:
sudo pacman -S smartmontools nvme-cli
3. Before running health checks, you need to know whether your SSD is SATA or NVMe, because each type reports SMART data slightly differently. Run the following commands in the terminal:
lsblk -d -o NAME,MODEL,ROTA,TYPE,SIZElsblk -d -o name,tran
4. You’ll see a list of drives with details. Look for sata or nvme under the “tran” column to identify your drive type. This ensures you use the correct commands in the next step.
5. Once you know your SSD type, you can retrieve its SMART health data. This will show overall health, wear level, temperature, and any warnings that indicate potential issues.
For SATA SSDs:
- Run a basic health check to see the overall status:
sudo smartctl -H /dev/sda– You’ll see whether the drive is PASSED (healthy) or flagged with warnings - For a complete report including firmware and device-specific information:
sudo smartctl -x /dev/sda
Take note: Replace /dev/sda with your drive’s actual device name.
For NVMe drives:
NVMe drives stores data differently, but you can still use smartctl or nvme-cli to view it.
- Using smartctl:
sudo smartctl -A /dev/nvme0n1– This shows NVMe-specific attributes such as temperature, percentage used, data units read/written, and critical warnings. A healthy drive will show no critical warnings and low percentage used - Using nvme-cli:
sudo nvme smart-log /dev/nvme0n1– This displays the NVMe SMART log, including critical_warning, temperature, available spare capacity, and percentage used. A healthy drive usually showscritical_warning = 0
» New to Linux? Learn which Linux command sends messages to network interface
How to check SSD health on macOS
macOS provides several ways to check SSD health, each suited to different users.
Method 1: Disk utility
This method is best suited for everyday users who want a quick confirmation that their SSD is recognized and shows no critical issues. You would typically use this method after installing a new SSD or to verify drive health without using the terminal.
Follow these steps:
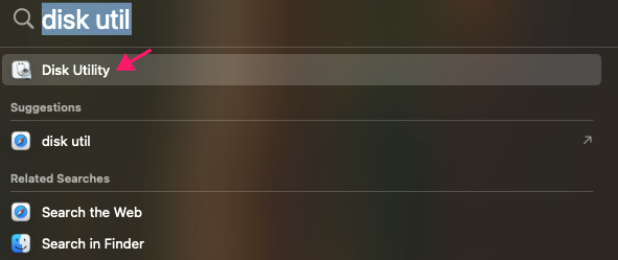
1. Press ⌘ Command + Space and search for Disk Utility
2. Select the SSD you want to inspect and look for the S.M.A.R.T Status field. Verified means no critical SMART issues were reported. To see additional drive information, right-click the drive and select Get Info
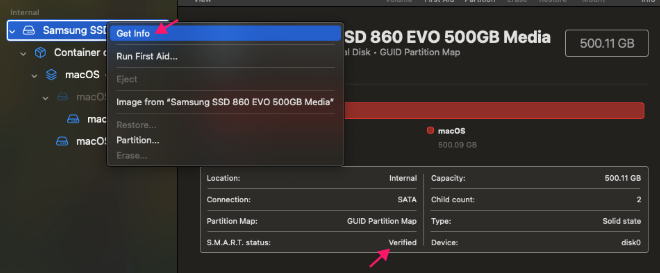
Take note: Disk Utility doesn’t show detailed SMART attributes like temperature or wear level.
» Find out how to screenshot on Mac
Method 2: Terminal
This method is best suited for users comfortable with the command line who want basic SMART data and drive information.
Follow these steps:
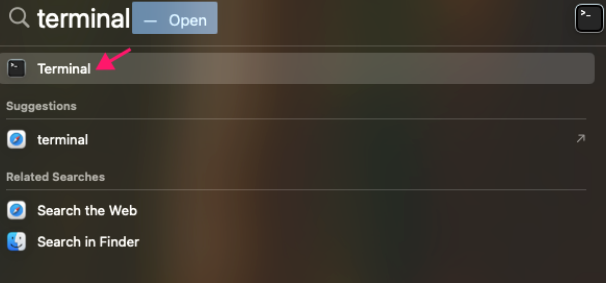
1. Press ⌘ Command + Space and open Terminal
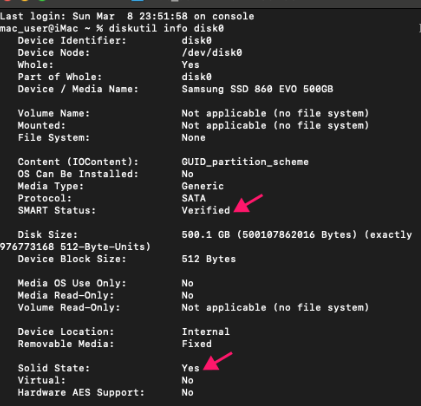
2. Run the command: diskutil info disk0
This shows the drive’s type, capacity, connection, and basic SMART status
» Here are essential scripts that every IT professional needs to know
Best practices to extend SSD lifespan
Proper maintenance can meaningfully extend your SSD’s lifespan without accelerating wear.
- Thermal management: Keep your SSD operating below the manufacturer’s temperature threshold (usually ~70 °C). Ensure adequate airflow and cooling if needed. Sustained heat above the safe limit increases cell wear and can cause permanent degradation.
- Workload optimization: Structure workloads to favor large, sequential writes instead of many small, random operations. This reduces write amplification and lowers unnecessary stress on NAND cells, helping the drive last longer under heavy use.
- TRIM verification: Verify that the TRIM command is active and processing discard operations. Active TRIM marks obsolete data for reuse, reducing garbage collection overhead and minimizing wear from repeated write-erase cycles. Use system commands (fsutil behavior query DisableDeleteNotify on Windows, fstrim on Linux/macOS) to check status.
- Firmware updates: Apply only vendor-recommended firmware releases. Updates fix bugs that could cause excessive write amplification or inefficient wear-leveling, preventing premature cell degradation. Avoid unverified or beta firmware unless explicitly advised by the manufacturer.
- Backup validation: Store backups on separate volumes rather than the SSD being protected. This reduces unnecessary writes and ensures the SSD is not burdened by repeated backup operations. Regular validation also confirms that restore strategies work when needed.
Keep your SSDs healthy
Monitoring SSD health across different operating systems is a core requirement for maintaining a stable infrastructure, but performing these checks manually for every endpoint is not a scalable solution. Atera’s RMM platform allows you to move away from individual machine troubleshooting by providing a unified view of your entire network.
By using Copilot, you can automate the diagnostic process without needing to write complex code from scratch. You can quickly generate and deploy PowerShell scripts to audit SMART status, track wear levels, and set up automated alerts the moment a drive shows signs of degradation.
Frequently Asked Questions
Related Articles

How to decide if you need a dedicated DEX platform, or already have one
"IT feels slow" is the complaint that often sells DEX platforms. Sometimes it signals a real blind spot, but just as often already catches and fixes the problem, and a new scoring layer would only add another console. Telling the two apart takes evidence, and the real gap usually isn't visibility at all.
Read now
How to set up secure printing across your organization
A secure print checkbox protects exactly one moment in a document's life. Everything else, from unencrypted traffic and unhardened devices to payroll printouts forgotten in a tray, stays exposed. Real secure printing covers the whole lifecycle: release policy, authentication, encryption, hardening, and a fleet that stays monitored long after rollout.
Read now
How to reduce alert fatigue in healthcare IT
In a hospital, a dismissed alert isn't a delayed ticket. It can be a patient deteriorating while the monitor keeps sounding. Cutting alert volume won't fix that on its own, and switching alerts off can make it worse.
Read now
How to prevent configuration drift across your IT infrastructure
Configuration drift rarely breaks anything the day it happens. It hides in a hotfix, a reset default, or a vendor installer, then surfaces weeks later as a failure nobody can trace. Stopping it means defining exactly what approved looks like, closing every side door into production, giving each setting one owning tool, and checking that the baseline itself hasn't gone stale.
Read nowEndless IT possibilities
Boost your productivity with Atera’s intuitive, centralized all-in-one platform