
Generate summary with AI

Most harddrives don’t fail with a warning label. They fail quietly at a rate you wouldn’t notice, then break completely. Technicians are no strangers to unnecessary tickets about broken harddrives in poorly managed IT environments.
Knowing what to check, when to check it, and what the results actually mean is the difference between swapping a drive on your own schedule and recovering from one that gave out on its own. Here’s how to do it on every OS.
What hard drive failure actually looks like before it happens
Most drives don’t go from “fine” to “dead” in one step. There’s usually a window (lasting weeks weeks to months) where the drive is telling you something before any tool flags an actual error.
The most common signs include:
- Increased latency in operations that used to be instant, especially on drives that haven’t changed workload
- Intermittent stalls or freezes during otherwise normal read/write activity
- Slower sequential read speeds compared to the drive’s baseline
- Repetitive soft clicking during normal read sessions
- Longer spin-up times, or repeated spin-up/spin-down cycling
- Grinding or scraping noises, which almost always point to head or platter contact
Any one of these in isolation might be nothing. It’s the pattern that matters. Specifically, if a drive is exhibiting more than one of these symptoms at once, or if a symptom is getting worse week over week, that’s your cue to pull SMART data before the drive completely bricks.
Consumer vs. enterprise drives
Manufacturers market enterprise drives on longer warranties and lower advertised failure rates, and the assumption is usually that enterprise-grade hardware simply lasts longer, but the environment complicates that more than the spec sheet does.
Enterprise drives typically run in climate-controlled, vibration-managed racks with constant monitoring. These conditions are far more consistent than the average consumer deployment, where temperature, handling, and duty cycle vary widely from one setup to the next.
That gets even more difficult to manage when you’ve got a distributed IT workload across the world, with cloud-managed devices using different specs and completely different workloads.
How to check hard drive health from one machine to a fleet
The right method depends on what you’re working with and whether it’s a single machine in front of you or a fleet you need visibility into without touching every desk. Here’s how to check drive health end to end on each major platform.
Windows
Use this on any Windows machine, starting with the built-in GUI check and moving to PowerShell when you need SMART-level detail or fleet coverage.
- Press Win + E to open File Explorer and select This PC in the left sidebar
- Right-click the drive you want to check and select Properties
Switch to the Tools tab and click Check under Error checking

Click Scan drive in the dialog that appears, even if Windows reports no errors found, to force a manual scan

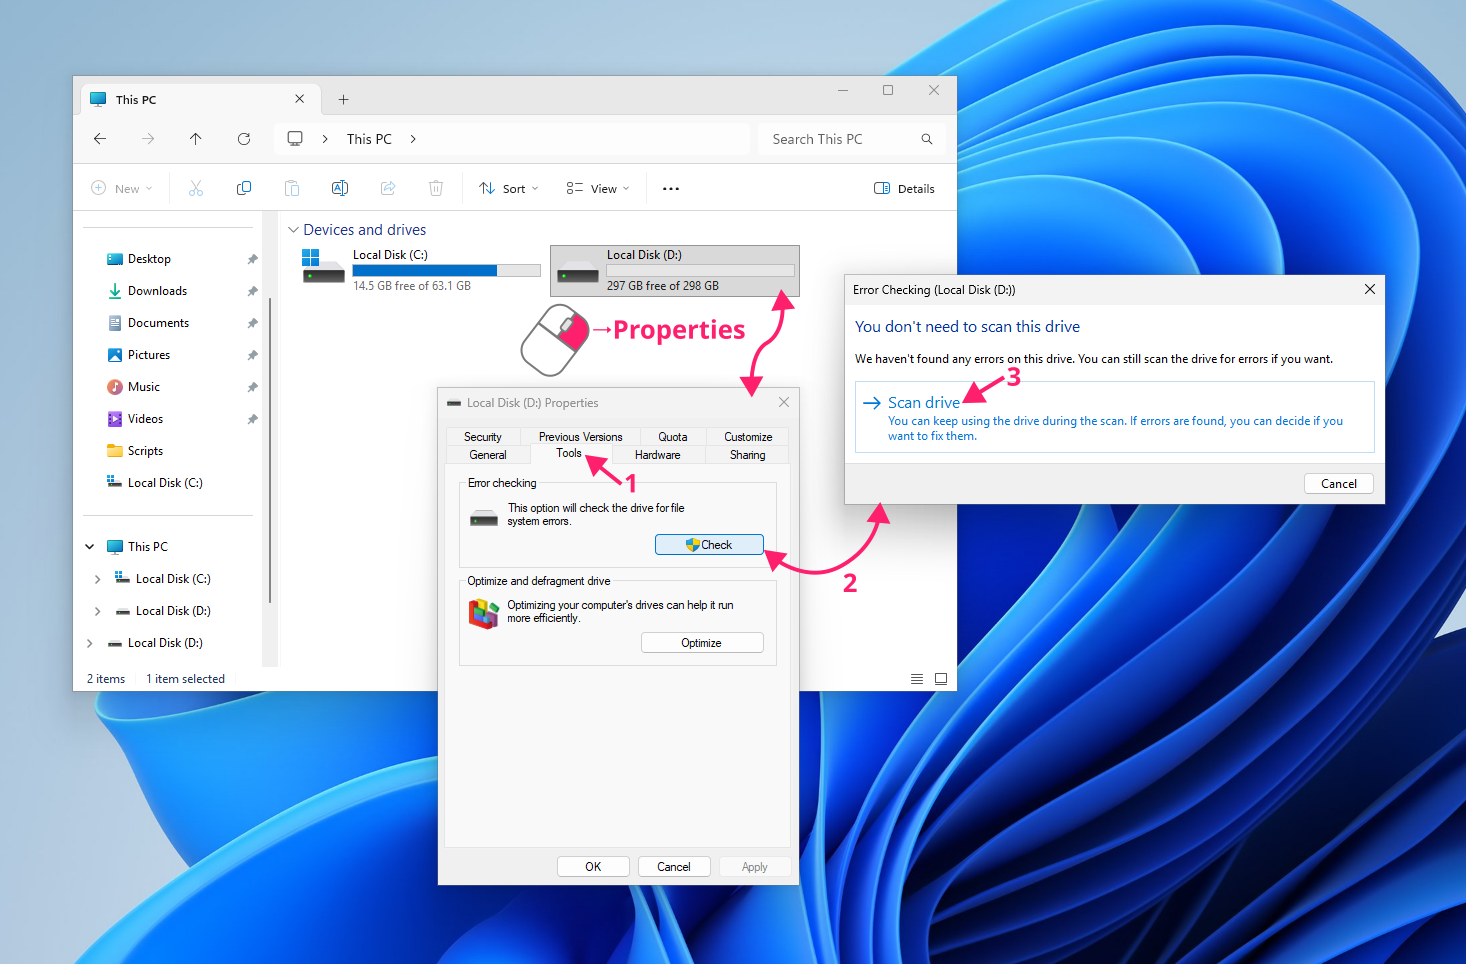
To use the command line instead, follow these steps:
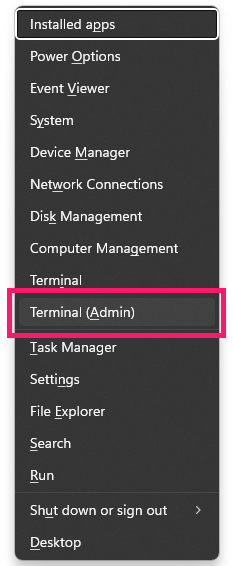
Right-click the Start menu button (or press Win + X) and select Terminal (Admin) to open PowerShell as administrator

- Run
Get-PhysicalDisk | Select FriendlyName, HealthStatus, OperationalStatusfor a basic health summary of all system drives Run
Get-PhysicalDisk | Get-StorageReliabilityCounter | Format-Listfor detailed reliability data, including temperature, wear, and error counts
If you need to run this from Command Prompt instead,
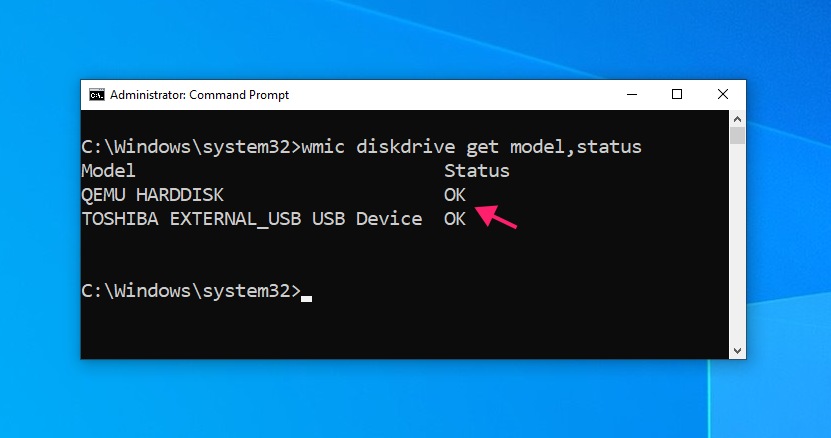
wmic diskdrive get model,statusworks, butwmicis deprecated in current Windows 11 builds, so useGet-CimInstance -ClassName Win32_DiskDrive | Select-Object Model, Statusinstead to get the same predictive failure status
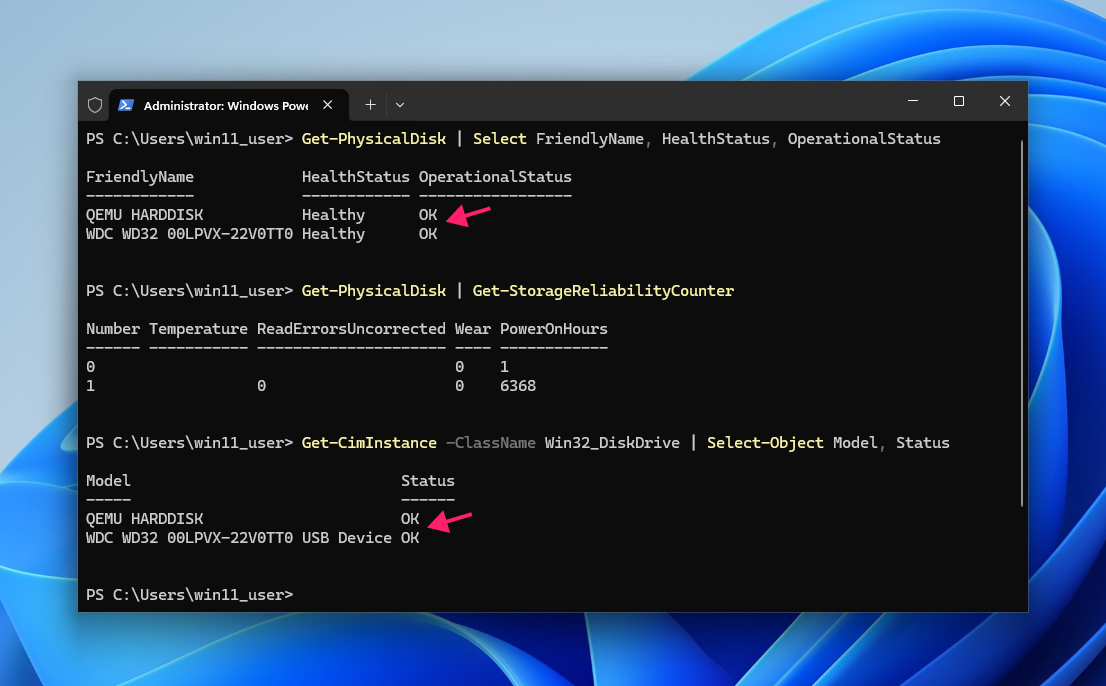
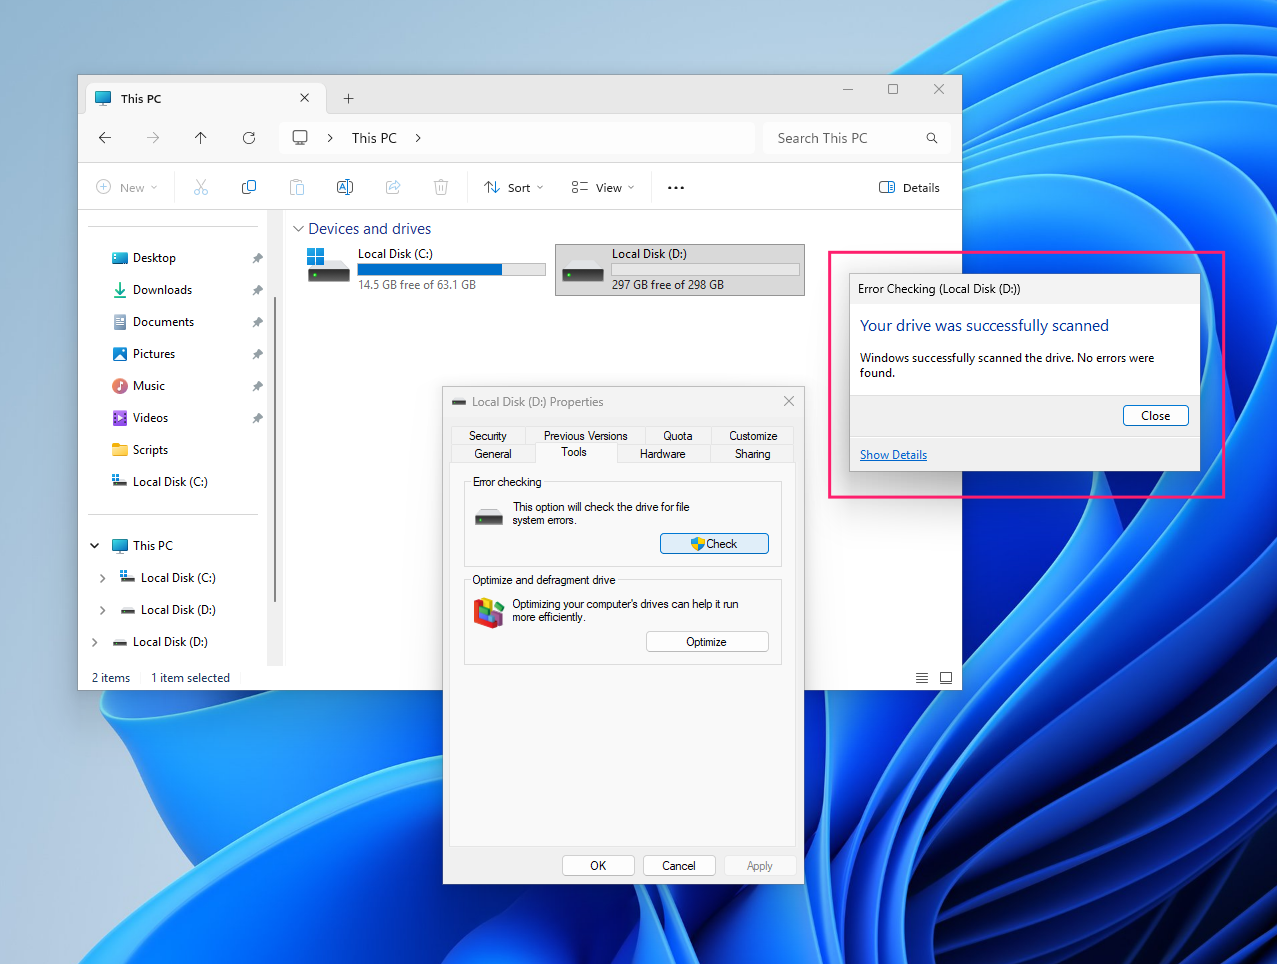
The Error Checking result only covers filesystem-level health: “Windows successfully scanned the drive. No errors were found” means the filesystem is clean, while “Restart your computer to repair drive errors” means Windows found logical issues but needs to lock the drive to fix them. Neither result rules out physical degradation, which is why the PowerShell check matters.
Here’s what you’re looking for:
- Rising read/write error counters or reallocated sector-equivalent fields point to physical degradation on the platter itself
- A high Wear value on its own is more relevant to SSDs than HDDs, and reflects usage rather than imminent failure
- Temperature spikes are worth flagging alone, but only become urgent alongside rising error counts: heat plus climbing errors signals a mechanical problem while heat alone is often just airflow
To scale this across a fleet, package the same Get-PhysicalDisk and Get-StorageReliabilityCounter commands into detection and remediation scripts and deploy them remotely via an RMM platform. With Atera, for example, you can ask AI Copilot to generate the script for you, then deploy it to all your endpoints using the RMM connection.
macOS
Use this on Mac systems, keeping in mind you’re most likely checking an SSD or external HDD, since modern Macs have moved away from spinning drives internally.
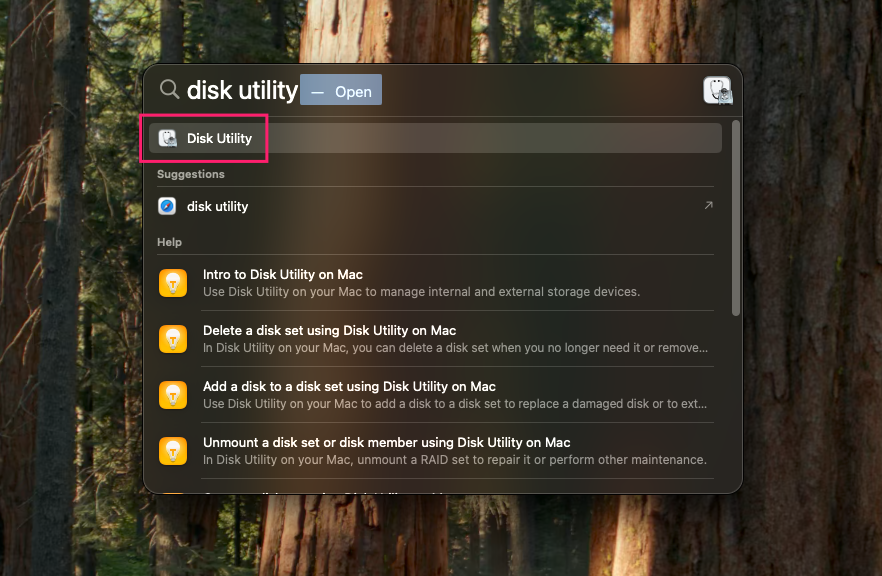
Press Cmd + Space, type
Disk Utility, and press Enter
Select your drive in the sidebar and check the S.M.A.R.T. status field: Verified means no hardware faults were reported, Failing means the drive has a hardware issue

Select the volume you want to repair and click First Aid in the top menu bar

Click Run in the confirmation prompt, then wait for the process to finish

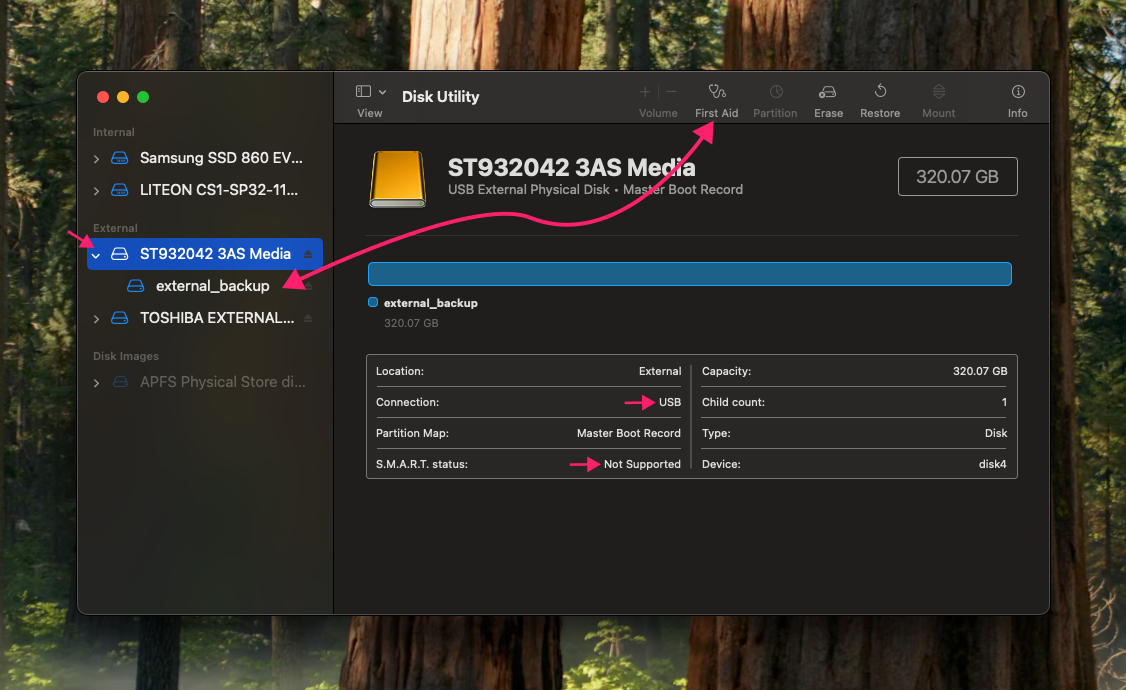
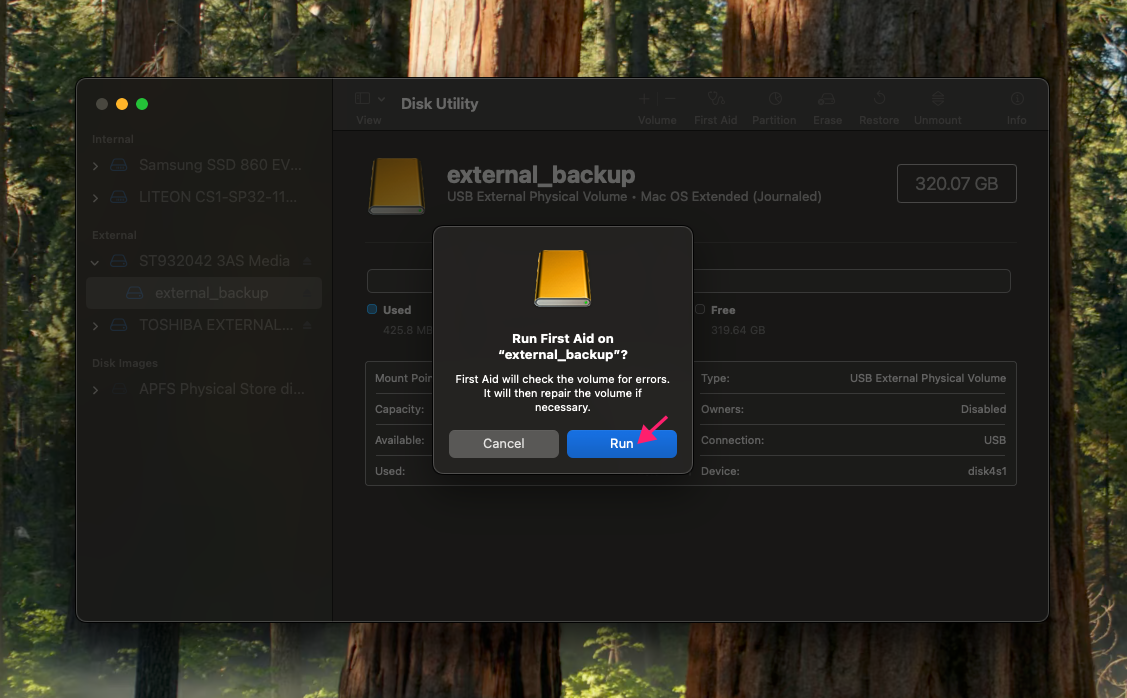
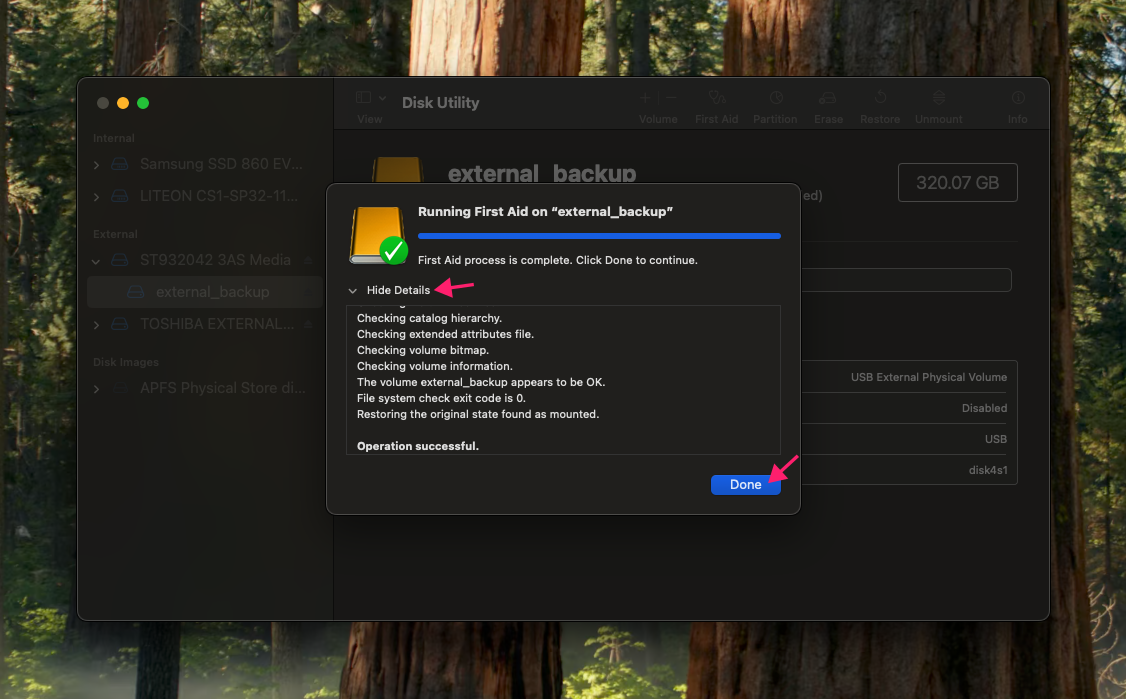
Note: Many external USB enclosures don’t pass through SMART data, so a Not Supported status isn’t cause for alarm on its own. It’s a limitation of the enclosure, not necessarily the drive. Once First Aid completes, you can expand the details section to review the log.
» Manage hardware across macOS devices by enabling RMM on Mac
Linux
Use this on any Linux system where you need a quick pass/fail check, detailed SMART data, and the option to monitor continuously rather than check manually.
- Run
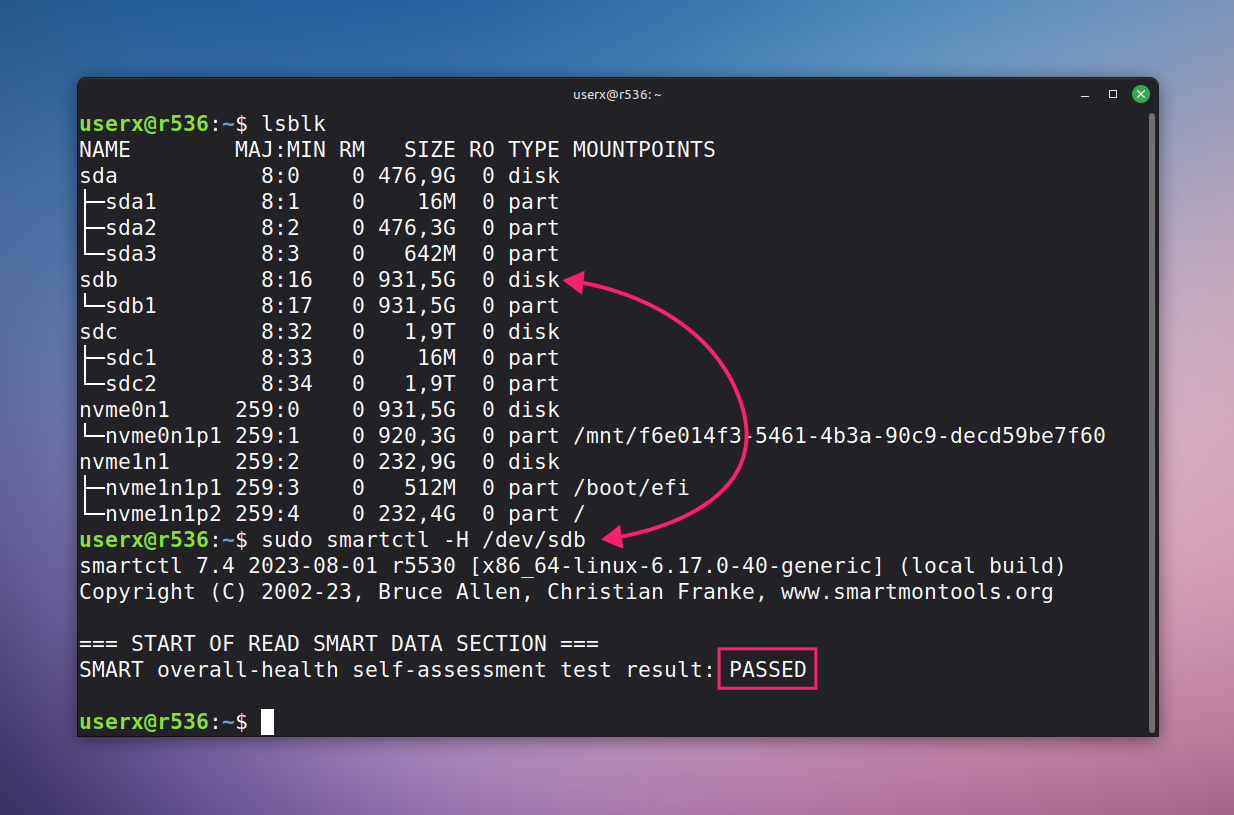
lsblkin a terminal to list currently connected drives If
smartmontoolsisn’t installed, depending on your Linux version, runsudo apt install smartmontools(Debian-based) orsudo dnf install smartmontools(Fedora/RHEL)
- Run
sudo smartctl -H /dev/sdbfor a quick pass/fail health check, replacing/dev/sdbwith your target drive Run
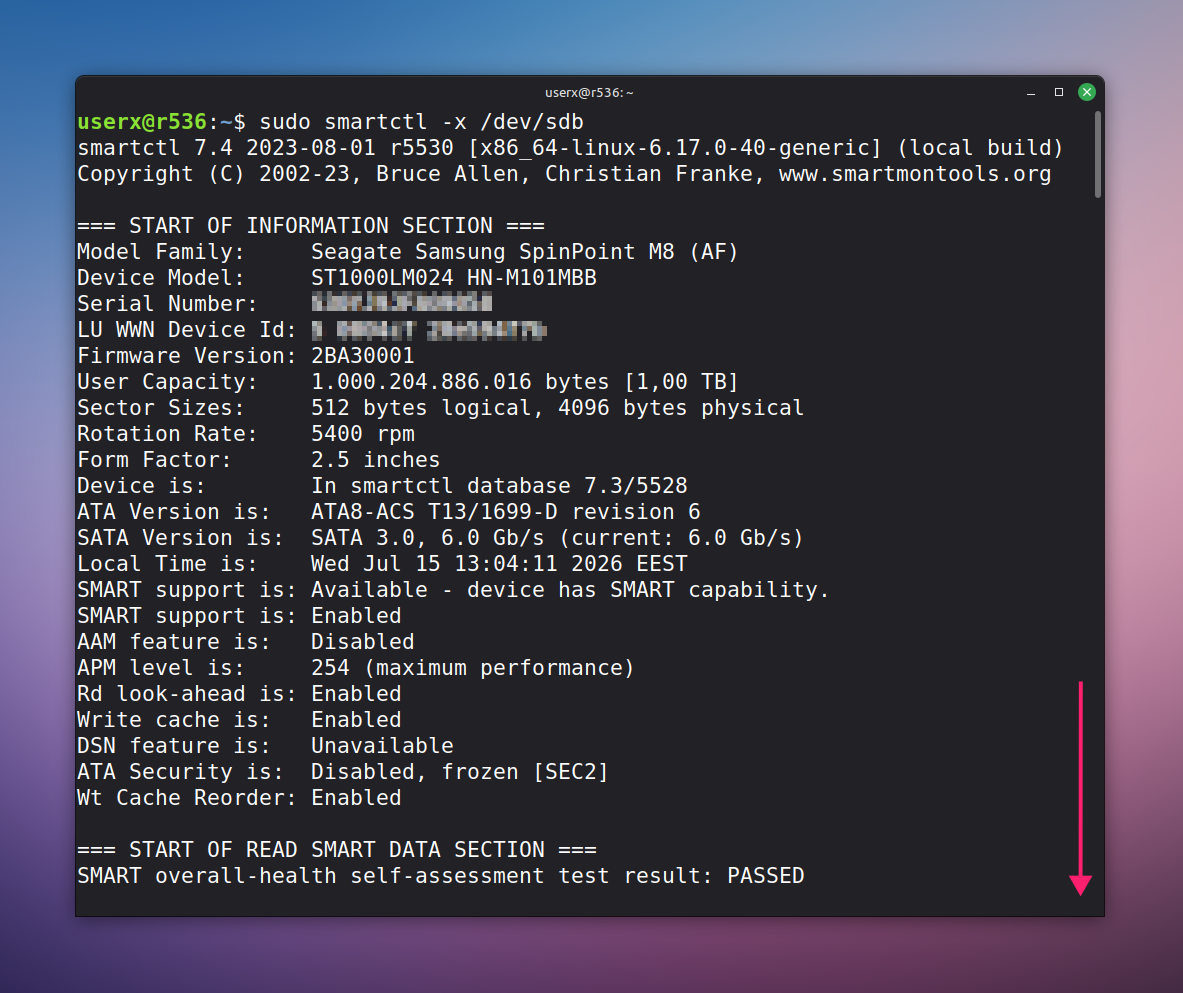
sudo smartctl -x /dev/sdbfor a detailed report, then scroll the output to review individual SMART attribute values
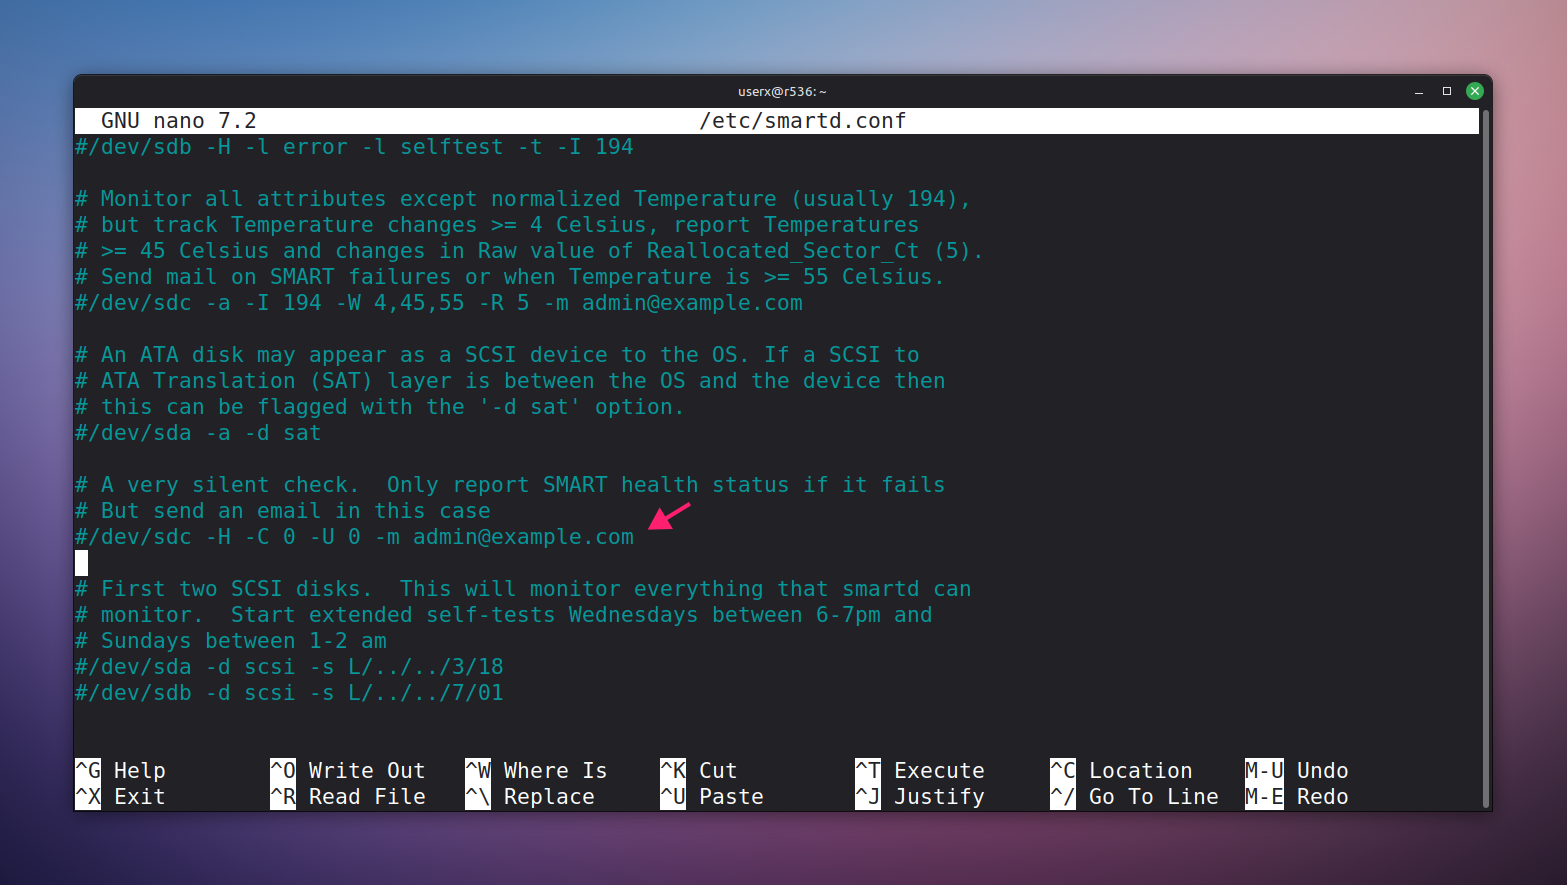
Enable background monitoring with
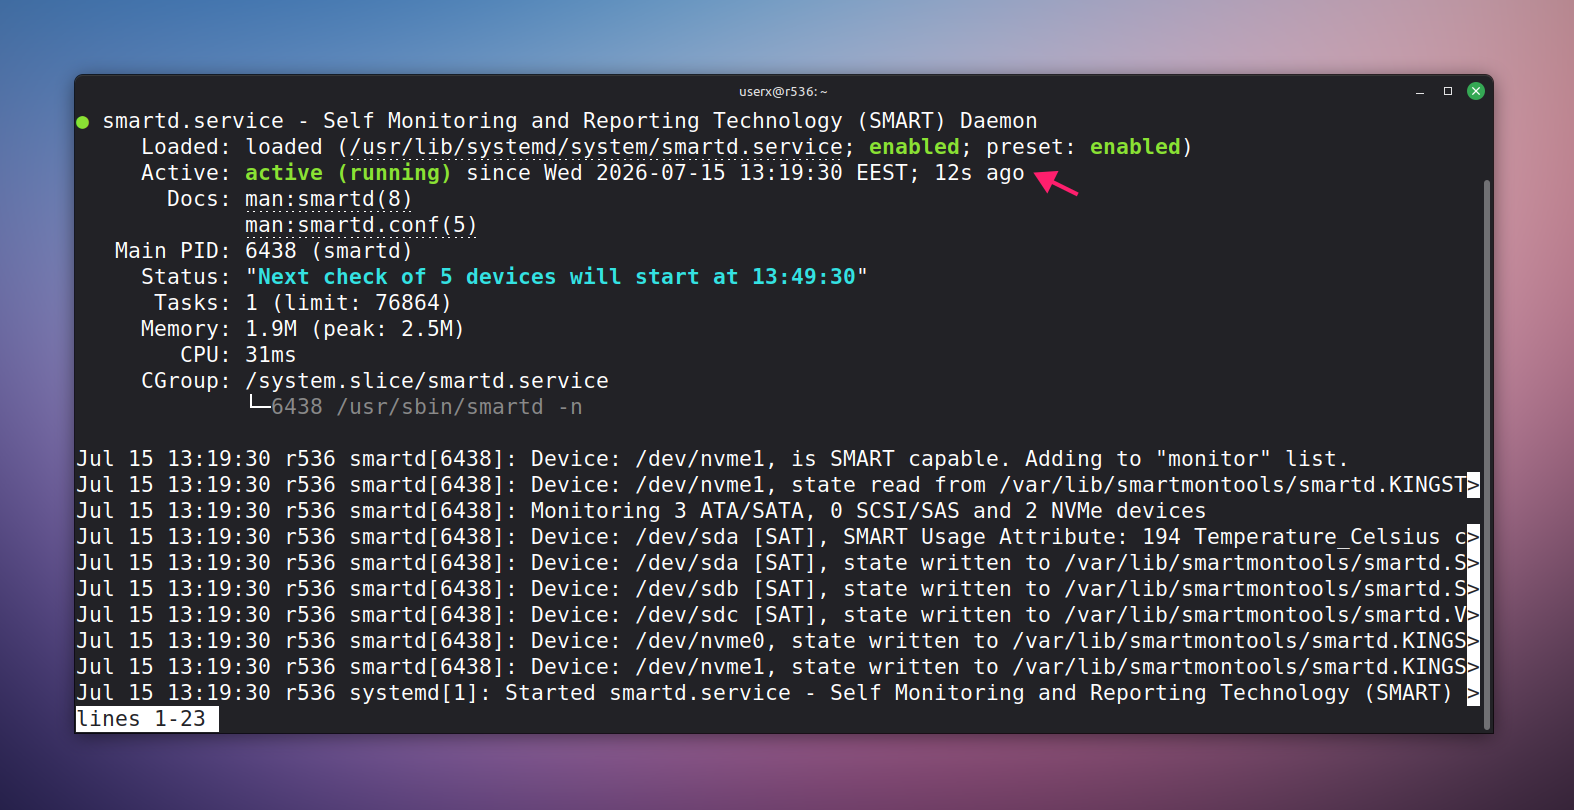
sudo systemctl enable smartd, start it withsudo systemctl start smartd, and confirm it’s active withsudo systemctl status smartd
Configuration, including email alerts on SMART failures, lives in /etc/smartd.conf
» Here’s how to paste into Linux terminal
Linux SMART attributes usually relate to two outcomes:
Mechanical wear (drive is physically degrading)
- SMART 5 (Reallocated Sectors Count): Rising count means the platter surface is degrading.
- SMART 10 (Spin Retry Count): Rising count points to motor or spindle problems.
- SMART 187 (Reported Uncorrectable Errors): Read/write operations ECC couldn’t recover.
- SMART 198 (Offline Uncorrectable Sector Count): Uncorrectable errors caught during background self-tests.
Logical errors (potentially fixable)
- SMART 197 (Current Pending Sector Count): Sectors flagged for re-check, not yet confirmed bad.
- SMART 199 (UltraDMA CRC Error Count): Data corruption in transit, often a cabling issue rather than the drive itself.
To scale this across a fleet, package the same smartctl commands into a script and deploy it across Linux endpoints using Atera’s Linux Agent. With automation profiles, you can schedule it to run on a recurring basis rather than setting up smartd and a separate monitoring stack by hand.
The limits of a “healthy” status
Built-in OS tools are designed to give you a fast pass/fail answer, not a detailed diagnosis. That’s useful for a quick check, but it means you’re working with the least amount of information the tool can get away with giving you.
A “Healthy” or “OK” status just means nothing has crossed a failure threshold yet, but it doesn’t really tell you how close the drive is to that threshold or how fast it’s trending toward it.
Even with a healthy status, here are some things that could still happen soon:
- Sudden, non-gradual failure: Mechanical shock, electrical faults, and environmental events (power surges, overheating, physical impact) can take out a drive that was reading perfectly healthy the day before. SMART tracks gradual wear; it doesn’t predict sudden catastrophic events.
- Reality vs thresholds: By design, SMART attributes only flag a problem once a value crosses a preset threshold. A drive can be trending badly, climbing steadily toward that line, and still report “Healthy” because it’s right at the edge of failure.
How to dig deeper
When you need more than pass/fail, a few third-party tools fill that gap:
- CrystalDiskInfo: Free, Windows-only, and open source. Displays the full SMART attribute table with color-coded health status (good/caution/bad) and supports configurable alerts on temperature or health changes.
- GSmartControl: Free and cross-platform (Windows, Linux, macOS). A GUI front end for
smartctlthat also supports running SMART self-tests directly from the interface. - HD Sentinel: Paid for Windows (free versions available for Linux and DOS). Adds surface scanning and failure estimates on top of standard SMART monitoring.
- DriveDx: Paid, macOS-specific. Built specifically to fill the gap Disk Utility leaves on Mac, since Apple’s native tool gives you SMART pass/fail only.
Checking hard drive health is a habit, not a one-time fix
A clean SMART report or a passed CHKDSK scan is really just one data point in an ongoing picture. Drives with a “Healthy” status still fail, and drives showing early warning signs can keep running for months. The value of checking regularly, whether on one machine or across a fleet, is catching the trend before it becomes an emergency.
Atera’s RMM platform gives IT teams and MSPs centralized visibility into device health across the endpoints they manage, so the checks in this guide don’t have to be run one drive at a time. Pair that visibility with automated patch management, scripting, and infrastructure monitoring, and a drive nearing failure becomes a scheduled replacement instead of a surprise support ticket.
» Learn how to manage your environment better with an Atera free trial
Related Articles

How to reduce alert fatigue across your IT team
Your technicians aren't ignoring alerts because they're careless. They're ignoring them because most alerts have taught them to. Once the stream stops being trustworthy, real failures slip past with the noise. Fixing it means deciding what deserves an interruption, tuning out transient spikes, collapsing alert storms, and automating the fixes you've run a hundred times.
Read now
How to close the IT skills gap on your team
Course completions don't close skills gaps. Technicians finish the training, then hand the first unfamiliar failure straight back to a senior engineer. Real capability gets built on live tickets, incidents, and maintenance windows, with guidance that fades as competence grows.
Read now
How to calculate cost per ticket (and why most teams get it wrong)
Most cost-per-ticket figures are wrong before anyone reads them. Missing overhead, tickets that were opened but never closed, spam and duplicates padding the count, and one month's costs divided by another month's tickets all make support look cheaper than it is. Fix both sides of the division and the number finally shows where technician time and money actually go.
Read now
How to prepare for a software license audit
A vendor audit notice doesn't wait for you to get organized. It demands proof, right now, that every install matches every entitlement you've paid for, and most IT teams find out the hard way how much they don't actually know about their own environment. Getting audit-ready before the letter arrives is the difference between negotiating from strength and paying for months of scrambling.
Read nowEndless IT possibilities
Boost your productivity with Atera’s intuitive, centralized all-in-one platform