
Generate summary with AI

Alert fatigue is causing real issues for IT teams. Splunk’s report found that 43% of IT professionals spend too much time responding to alerts, and 73% have experienced an outage as a result of an ignored or suppressed alert.
With the right LogicMonitor alternative, this can be avoided. Below, we’ve compared seven top alternatives to LogicMonitor, broken down by key features, pricing, and what real users have to say.
7 best Logic Monitor alternatives in 2026
Want a quick overview of each alternative? Check our overview table here:
| Platform | Best For… | Philosophy |
| 1. Atera | Scaling profitably with autonomous IT | RMM, remote access, PSA, and helpdesk with additional Autonomous IT agent layered on top |
| 2. Datadog | Full-stack observability | Broad monitoring and analytics in one platform |
| 3. Dynatrace | AI-driven problem detection | Automated, AI-powered APM |
| 4. Paessler PRTG | Smaller IT teams monitoring networks | Sensor-based network monitoring |
| 5. ManageEngine OpManager | Budget-conscious network monitoring | Modular NMS with add-on products |
| 6. Zabbix | Teams that want open-source flexibility | Self-hosted, highly customizable monitoring |
| 7. SolarWinds Observability | Teams already using SolarWinds tools | Observability within the SolarWinds ecosystem |
1. Atera

Atera vs. LogicMonitor: Key differences
For IT teams drowning in alerts, the difference comes down to this: LogicMonitor tells you something is wrong. Atera, with Robin layered on top, can also fix it.
1. Key features: Atera and LogicMonitor both give IT teams visibility into their infrastructure, but are built around different models. LogicMonitor is an observability platform that focuses on infrastructure, cloud, and network monitoring.
In contrast, Atera is an IT management platform used by enterprises, IT teams, and MSPs that gives you access to all the IT essentials:
- Atera’s RMM
- Patch management
- Asset management (and discovery)
- Reporting and analytics
- Helpdesk and ticketing
- IT automation & scripting
- Atera’s AI Copilot
- PSA
For teams that want autonomous issue resolution, Robin is available as a separate product on top of this.
2. Robin by Atera: Unlike most AI chatbots, Atera’s Robin is capable of solving real-world IT issues fully autonomously. It does this by interacting with end users via Slack, email, Teams, or your Customer Portal, all without technician involvement.
Robin is capable of autonomously resolving up to 92% of Tier-1 and complex Tier-2 technical incidents.
3. Customer support: LogicMonitor’s support is tiered and based on the support package you select. In comparison, Atera offers 24/7 live chat support for all of its users. Plus, you can reach out for help through Atera’s knowledge base, its IT community, webinars, and video tutorials.
P.S. For more differences, see our full Atera vs. LogicMonitor comparison here.
Customer review and ratings
Atera’s G2 rating: 4.6 out of 5.0 stars (1,200+ reviews)
What Atera users are saying on G2:
- “Robin can reduce technicians’ workload by assisting with responses, ticket handling, and general troubleshooting,” a G2 user says.
- “Integrations are another big plus. Atera connects with other platforms and tools, which streamlines the technicians’ workflow and reduces manual effort,” a G2 user says.
Atera’s Capterra rating: 4.5 out of 5.0 stars (440+ reviews)
What Atera users are saying on Capterra:
- “The interface is clean, automation features save time, and it helps improve efficiency for daily IT operations,” a Capterra user says.
- “Having RMM, ticketing, patching, and remote access all in one platform definitely helped cut down on tool sprawl and kept things simpler day to day,” a Capterra user says.
Pricing and value for money
Atera’s MSP pricing plans are:
- Pro: $129/month, per technician
- Growth: $159/month, per technician
- Power: $209/month, per technician
- Superpower: Custom quotation
Atera’s IT department pricing plans are:
- Professional: $149/month, per technician
- Expert: $189/month, per technician
- Master: $219/month, per technician
- Enterprise: Custom quotation
Each plan comes with a 30-day free trial.
2. Datadog
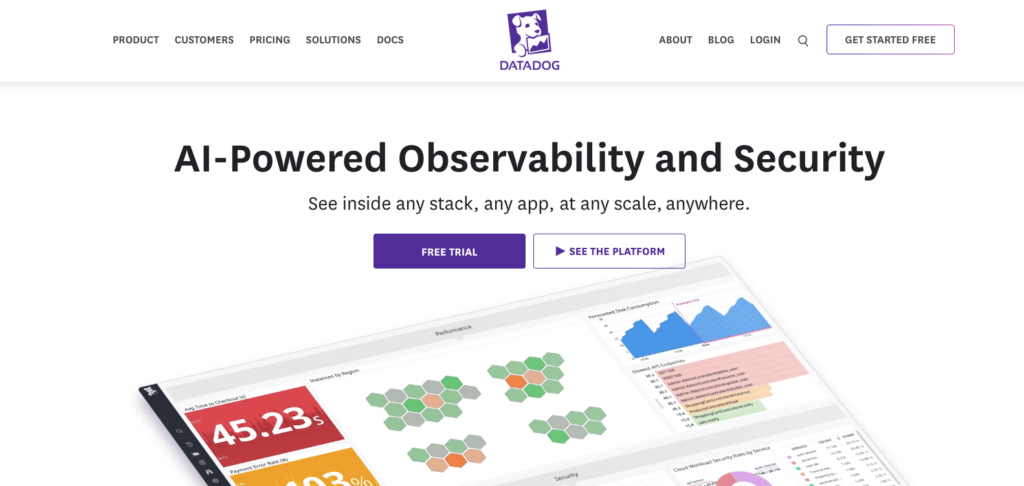
Datadog is an observability platform that combines infrastructure monitoring, APM, log management, and security monitoring into one solution. This is backed by over 1,000 cloud and on-prem environment integrations.
On one Reddit thread, users describe Datadog as highly capable for infrastructure and application monitoring, but also say that it has a steep learning curve. Datadog alternatives, like Atera, are a better choice if you value a quick ramp-up time.
G2 Rating: 4.4 out of 5.0 stars (600+ reviews)
Capterra Rating: 4.6 out of 5.0 stars (300+ reviews)
Datadog Pricing:
- Free: $0/month for up to 5 hosts
- Pro: Starting at $15/month per host
- Enterprise: Starting at $23/month per host
- DevSecOps Pro: Starting at $22/month per host
- DevSecOps Enterprise: Starting at $34/month per host
3. Dynatrace
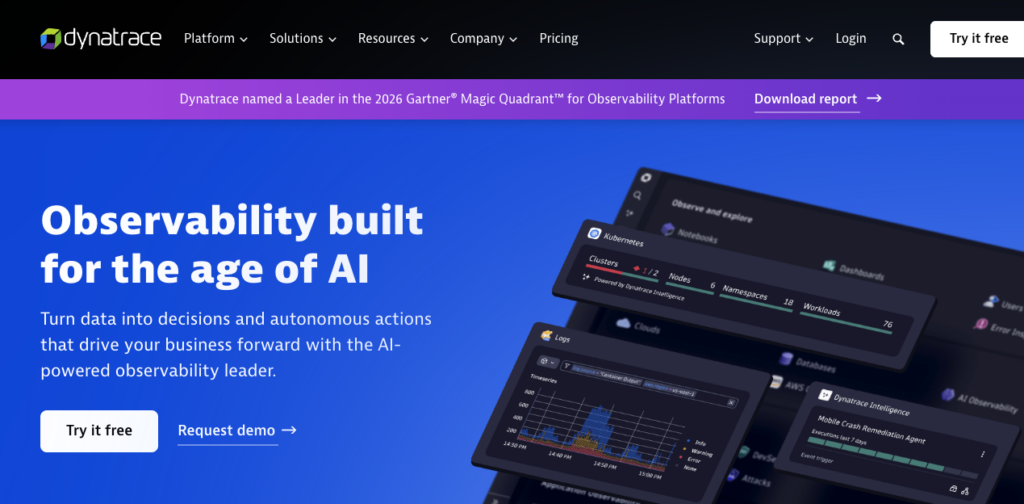
Dynatrace is a full-stack observability platform for organizations. One of its main selling points is its “Davis AI engine”, which automatically detects and prioritizes problems in large IT environments.
Comparing Dynatrace to Logic Monitor, most users agree that Dynatrace is stronger for large environments. One Reddit user mentioned using it for supporting APIs with a few million users a day. However, this comes at an extremely high cost. Alternatives, like Atera, with per-technician pricing, are more cost-effective options.
G2 Rating: 4.5 out of 5.0 stars (1,000+ reviews)
Capterra Rating: 4.6 out of 5.0 stars (70+ reviews)
Dynatrace Pricing:
- Foundation & Discovery: $7/month per host
- Infrastructure Monitoring: $29/month per host
- Full-Stack Monitoring: $58/month per host
4. Paessler PRTG
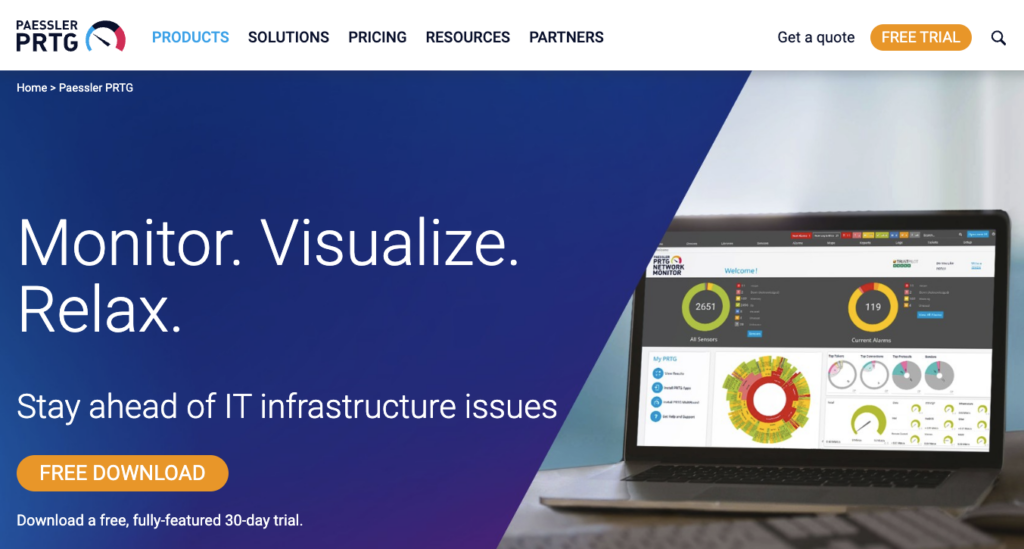
Paessler PRTG is a solid option if you need an all-in-one solution for tracking network availability and your overall IT infrastructure health. Like solutions like Atera, it offers automated network discovery of devices and services on your network.
One user described his experience with PRTG and said, “PRTG is what I recommend to smaller teams who have limited knowledge. Its pricy but easy to use.” For enterprises wanting access to advanced technologies like an Autonomous IT agent, Paessler alternatives, like Atera, are a better fit.
G2 Rating: 4.6 out of 5.0 stars (100+ reviews)
Capterra Rating: 4.6 out of 5.0 stars (250+ reviews)
Paessler PRTG Pricing:
- PRTG 500: $137/month for about 50 devices
- RTG 1000: $242/month for about 100 devices
- PRTG 2500: $508/month for about 250 devices
- PRTG 5000: $908/month for about 500 devices
- PRTG 10000: $1,225/month for about 1,000 devices
5. ManageEngine OpManager
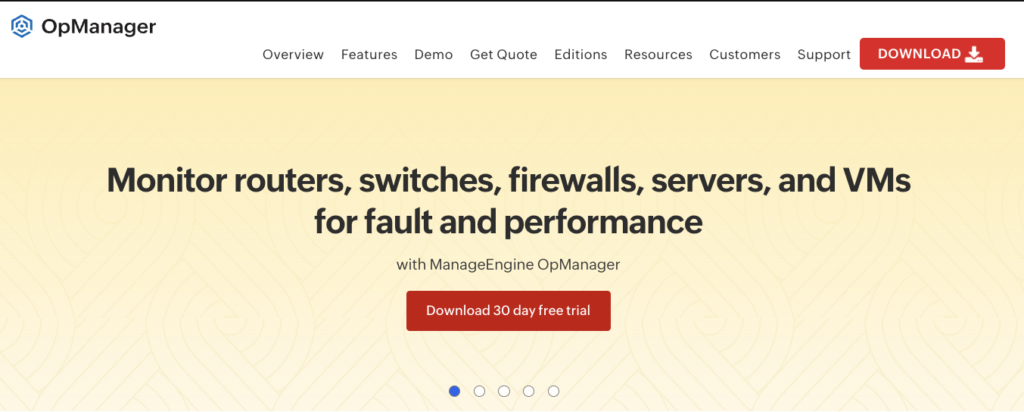
Part of ManageEngine’s product group, OpManager is a network monitoring software that gives visibility into your routers, switches, servers, printers, and other network devices. It’s a suitable choice for teams valuing affordability.
A common complaint from users is that OpManager works well as a standalone product, but when stacked with other ManageEngine products, it becomes hard to manage.
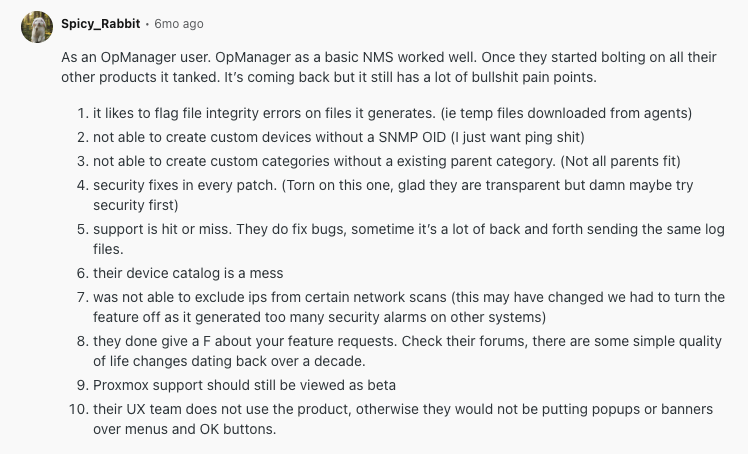
One of ManageEngine’s alternatives, Atera, combines RMM, patch management, network discovery, and asset management into one product, meaning this issue is eliminated.
G2 Rating: 4.4 out of 5.0 stars (100+ reviews)
Capterra Rating: 4.6 out of 5.0 stars (100+ reviews)
ManageEngine OpManager Pricing:
- OpManager Standard Edition: Starting at $95/year for 10 devices (max. 2 users)
- OpManager Professional Edition: Starting at $145/year for 10 devices (max. 2 users)
If you want to exceed your plan’s user limit, there is a $38/user per year extra cost.
6. Zabbix

If you value full customization, Zabbix can be a good choice. It’s an open-source monitoring tool that can be configured to track almost any type of infrastructure (given enough setup time).
Users comment on Zabbix saying, “once you learn it, you can monitor just about anything.” But being open-source, it comes with issues, such as post-update problems (due to lack of support) and potential security issues. Fully managed network monitoring software, like Atera’s platform, removes these issues entirely.
G2 Rating: 4.4 out of 5.0 stars (200+ reviews)
Capterra Rating: 4.7 out of 5.0 stars (100+ reviews)
Zabbix Pricing:
- Zabbix has both cloud-based and self-hosted options available. The pricing for the cloud version starts at $50/month
7. SolarWinds Observability
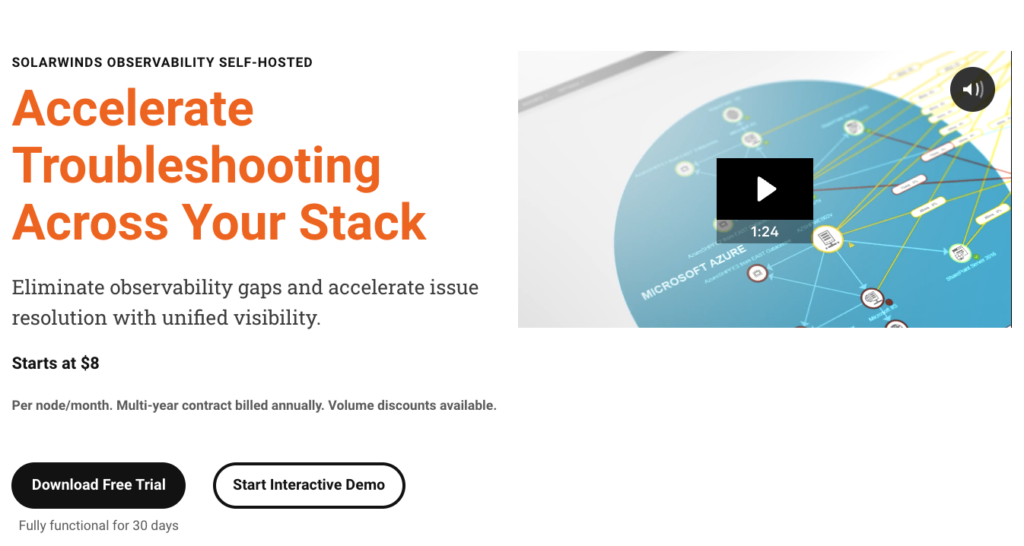
SolarWinds Observability is part of the broader SolarWinds product suite. It covers infrastructure, application, and network monitoring under one solution.
While highly capable, users have reported steep price increases at renewal (up to a 70% increase for Observability). Atera publishes its per-technician plans upfront, so IT teams know their costs going in.
G2 Rating: 4.3 out of 5.0 stars (790+ reviews)
Capterra Rating: n/a
SolarWinds Pricing:
- Application Observability: $27.50 per service
- Network and Infrastructure Observability: $15.75 per active network device
- Log Observability: $5 per GB, per month
Why look for a Logic Monitor alternative?
Here are the limitations Logic Monitor users have reported on the platform.
1. Steep learning curve
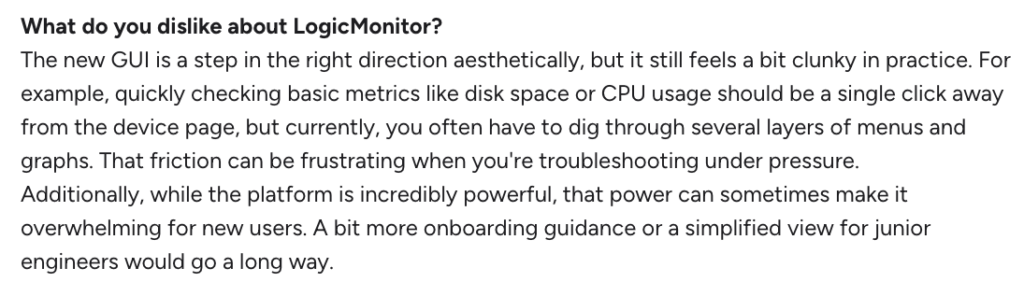
This is the main con of Logic Monitor on G2. Users on G2 wish the UI of LogicMonitor would be more intuitive for new users, which would make the onboarding process faster.
For example, Shuel Kahn K. said that while the new UI is good aesthetically, it feels clunky in practice.
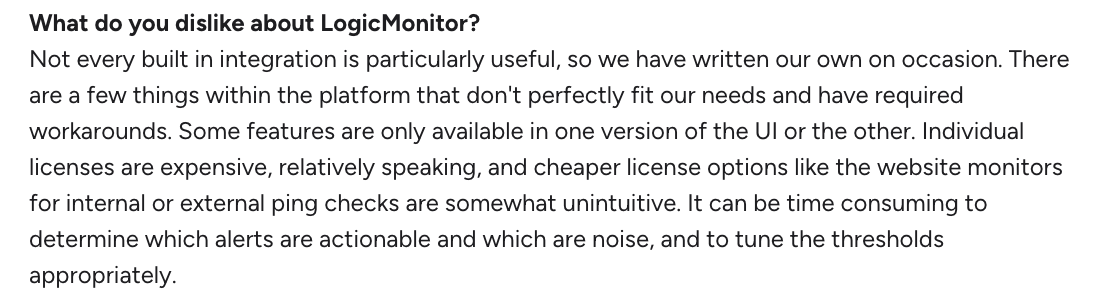
Wren D. also said that some features are only available in one version of the UI or the other.
2. Confusing pricing model
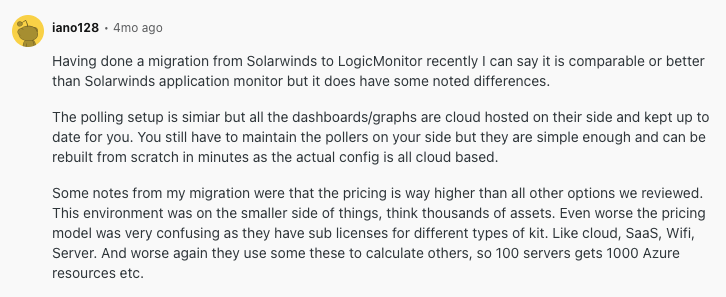
One Reddit user who migrated from SolarWinds to LogicMonitor said: “The pricing is way higher than all the other options we reviewed.”
He added by saying that not only is the pricing high, but it’s complex. There are sublicenses for different types of kits, such as cloud, SaaS, wifi, and servers.
What are the strengths of Logic Monitor?
Let’s also look at a few strengths that Logic Monitor users have shared about the platform.
1. Highly customizable
One user said, “You can easily customize just about every facet of the monitoring.”
In fact, if you’re willing to bear the high price and potential steep learning curve, LogicMonitor does offer a lot of flexibility.
2. Reduces alert fatigue
LogicMonitor helps to reduce alert fatigue through its “Alert rules” and AI filtering features.
Keerthi R. said, “The AI-driven insights cut through the noise, so instead of drowning in alerts, I get clear, actionable information.”
The pros and cons of Logic Monitor: An overview
To conclude the two previous sections, here are the pros and cons of Logic Monitor.
The pros:
- Highly customizable (users say you can tune nearly every setting)
- AI filtering and alert rules help to reduce alert fatigue
The cons:
- Steep learning curve, especially navigating the newer UI
- Pricing is high and split across confusing sub-licenses
Frequently Asked Questions
Related Articles

Atera alternatives in 2026
Compare Atera to NinjaOne, ConnectWise, SuperOps, Pulseway, and ServiceNow on pricing, features, and ratings.
Read now
7 best Gorelo alternatives for IT teams in 2026
Comparing Gorelo against its alternatives? We break down 7 alternative options on features, pricing, and reviews.
Read now
The 7 Best RemotePC Alternatives in 2026
The 7 best RemotePC alternatives in 2026, reviewed. Find tools with stronger remote access, Agentic AI, and broader IT management features.
Read now
The 7 Best Quest KACE alternatives in 2026
Read on to learn about the best Quest KACE alternatives. Find each one’s pricing and features, and see what makes Atera’s Agentic AI stand out.
Read nowEndless IT possibilities
Boost your productivity with Atera’s intuitive, centralized all-in-one platform